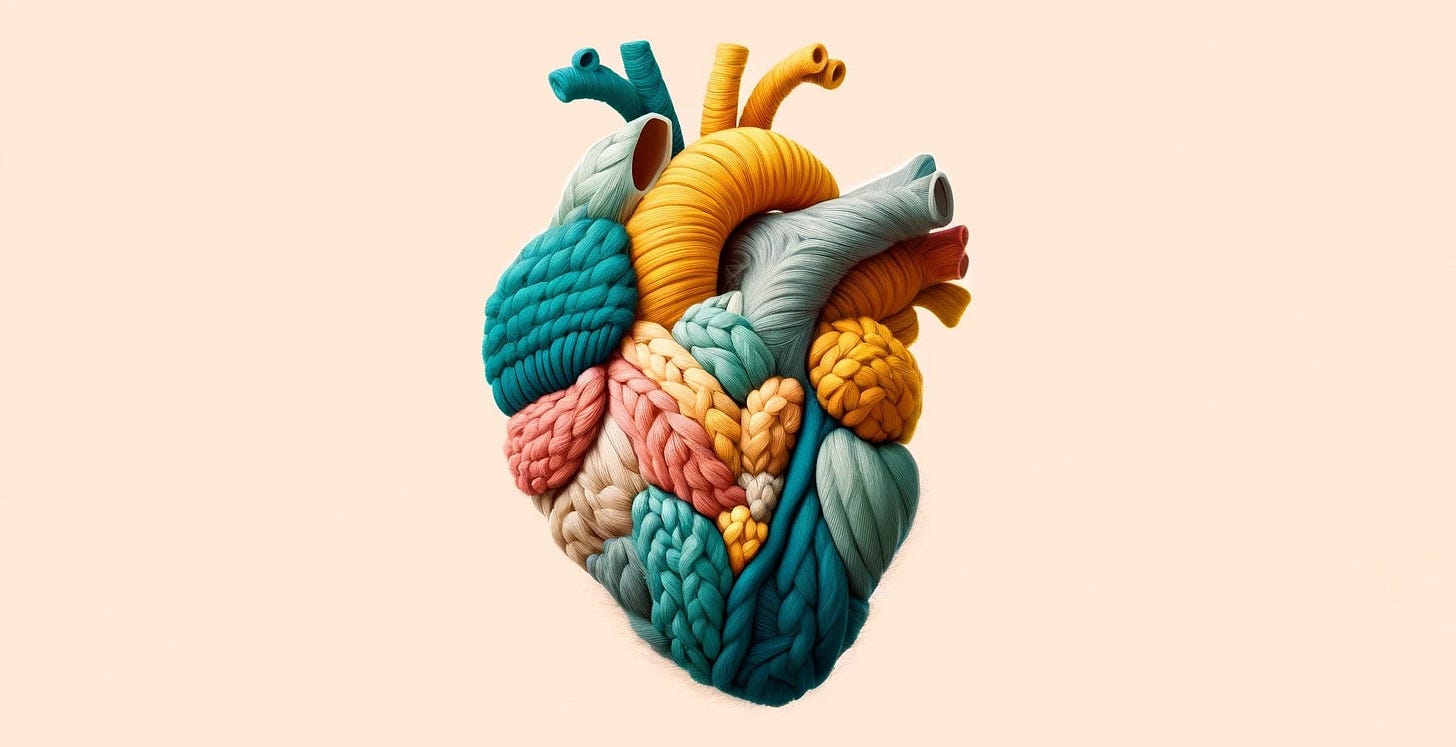
AI Can Now Look At Your Heart & Predict How Long You'll Live.
A Deep Dive Into How The Human Heart Works And How An AI Model Can Predict Human Survival Using Cardiac Images
AI is being used to solve complex healthcare problems like never before.
A team of researchers at Imperial College London put forward an amazing AI model that can now ‘look’ at the complex 3D images of a beating heart and predict human survival.
This story is a deep dive into how it was made possible.
Before we go into the actual details of this AI model, let’s learn a bit about how the human heart works.
An Introduction To The Human Heart
The heart is a big muscular organ that pumps blood throughout one’s body.
It has four contractile chambers —
Two upper and smaller chambers called Atria (singular Atrium)(left and right)
Two lower and larger chambers called Ventricles (left and right)
The atria open into the ventricles on each side respectively.
Here’s how blood flows through the whole system.
The left ventricle of the heart pumps oxygenated blood to all the body organs.
These organs use up the blood oxygen and the deoxygenated blood is returned to the right atrium of the heart.
This blood moves through the right ventricle to reach the lungs where more oxygen is added to it.
This oxygenated blood travels through the left atrium and ventricle to finally reach all the body organs.

What Is Pulmonary Hypertension?
The blood vessels in one’s lungs can sometimes get damaged and narrowed leading to high blood pressure in the lungs.
This condition is called Pulmonary Hypertension.
Some common causes of Pulmonary hypertension are listed below —
Genetic mutations
Drugs and toxins
Disease of the left side of the heart that causes pressure to build up ‘back’ in the lungs
Inflammatory disorders like Vasculitis
Blood clots in the lung vessels
Idiopathic (where no cause can be found)
Pulmonary Hypertension makes it harder for blood to flow through the lungs and this in turn causes the heart (right ventricle) to work harder to pump blood through those vessels.
This leads to a compensatory increase in the size of the right ventricle to support the extra work that it needs to do.
Unfortunately, this increase in size (called Right Ventricular Hypertrophy) leads to a stiff heart and turbulent blood flow, leading to a state where the affected person is at a high risk of dying from the disease.
Conventionally, the prognosis and choice of treatment for a patient is individualized according to the:
Clinical risk factors (such as Age, Sex, Six-minute walk distance etc.)
Volumetric indices derived from heart imaging (such as Right Ventricular Ejection Fraction, End-diastolic volume, End-systolic volume etc.)
But these are not the most accurate and hence, a way to improve prognostic accuracy would change the lives of people living with this condition.
And this is what these researchers achieved with the help of AI.
An Overview Of The Survival Prediction AI Model
To start with, the Cardiac MRI images from multiple patients diagnosed with Pulmonary Hypertension were obtained.
If you’re new to this imaging technique, you’d be surprised how detailed the images obtained by it are!
Take a look below.

(If you’re curious about how MRI works, check out one of my previous articles on this topic.)
Next, the Cardiac MRI images were processed to identify and track the 3D motion of the ventricles of the heart using segmentation.
A Fully Convolutional Network (FCN) was used for image segmentation at this step.
The obtained 3D motion models were input into another neural network referred to as “4DSurvival”. This is essentially a modified Supervised Denoising Autoencoder (DAE).
This model aimed to learn latent representations of the motion of the heart and predict a patient’s survival based on these.
Surprisingly, this model significantly outperformed the traditional clinical approach when it comes to survival prediction accuracy.
The prediction accuracy was quantified using Harrell’s C-index, a popular metric used to evaluate risk models in survival analysis.
Impressively, the model had a C-index of 0.75
as compared to the human benchmark of 0.59
!
A Deep Dive Into The Survival Prediction AI Model
Let’s learn how the research was done to build this AI model from scratch.
To begin, Cardiac MRI images of 302 patients diagnosed with Pulmonary Hypertension associated with Right Ventricular dysfunction were obtained.
Segmentation Network
A Fully Convolutional Network (FCN) was set up and was given manually labelled Cardiac MRI images as input.
The network architecture is shown in the image below.

The model aimed to learn important anatomical landmarks within these images and to segment the images into two ventricles (right and left).
Predefined 3D shapes of the heart from standard atlases were next, used to refine the network’s segmentation capabilities.
The entire task was treated as a Multi-task Classification problem where each pixel of the images is classified to belong to a particular segment (ventricle) and to include a particular anatomical landmark.
The following overall loss function was minimised during the model training using Stochastic Gradient Descent (SGD).

The loss function L(W)
consists of the following variables —
LS(W)
andLD(W)
are region-associated losses that the network minimizes to predict segmentation maps in the imagesLL(W)
is the landmark-associated loss that is used to predict anatomical landmark locations in the imagesα
,β
andγ
are weight coefficients that balance each of the individual losses to determine their importance in the overall loss∥W∥²F
is the weight decay term that prevents the network from overfitting
Further details of these loss functions can be found here.
This network’s outputs are further refined to create temporal segmentation maps as shown below.

Next, displacement vectors are created for the trajectory of each point in the right ventricle to understand how it moves throughout the cardiac cycle.
These displacement vectors are concatenated to create a representation of the motion of the entire right ventricle across the cardiac cycle.
These serve as the input feature for the prediction network called “4DSurvival” (described next).

4DSurvival: The Prediction Network
This network is a hybrid of a Denoising Autoencoder (DAE) and a Cox proportional hazards model and the features extracted from the cardiac imaging data (as described previously) are inputs to it.
Let’s learn how the DAE works first.
Denoising Autoencoder (DAE)
This network consists of an encoder and a decoder that are architecturally symmetrical to each other.
The first layer of the encoder aims to corrupt the input data stochastically by using Dropout.
These corrupted inputs are passed to a hidden layer and then to a central layer that represents the compressed/ latent version of the input data.
This latent representation is then fed to the muti-layer decoder that aims to upsample it to the original representation.
The difference between the original input and the decoder’s reconstructed representation is penalized using the Reconstruction Loss (L(r)
) which is simply the Mean Squared Error shown below —

where:
n
is the sample sizex
is the original/ non-corrupted inputψ(ϕ(x))
is the decoder’s reconstructed output
The purpose of this network is to learn important latent representations of the cardiac imaging inputs, that are robust to noise and can be used for accurate survival prediction.
In addition to being linked to the decoder, the latent representations of the encoder are also fed to a separate prediction branch which is based on a linear Cox proportion hazards model.
Let’s learn what this model is.
Cox Proportion Hazards Regression Model
This is a statistical model used to analyse data with variables that link to the time when a particular event occurs (like disease reoccurrence, death or any other endpoint).
Such data is called Survival data or Time-to-event data.
Real-world survival data often comes with incomplete information about the event of interest.
This is represented by Censoring. Two of its types are —
Left Censoring: This occurs when an individual enrolled in a study has already had the event before the study even began. Hence, the time of event occurrence is not exactly known.
Right Censoring: This occurs when the event of interest has not occurred by the end of the study, or when the individual is lost to follow-up.
This type of censoring is quite common in real-world survival data and the Cox model is designed to handle such censored data.
It is formulated as:
h(t) = h0(t) exp(β1X1 + β2X2 + ⋯ + βpXp)
where:
h(t)
is the hazard at the timet
or the risk/chance of an event happening at the timet
, given it has not happened yet.h0(t)
is the baseline hazard. It describes what the hazard rate would be if all covariates were zero.X1, X2, ... , Xp
are covariates or variables that affect the hazard rate for example, age, treatment group (case/ control), gender etc.β1, β2, … , βp
are coefficients associated with each covariate
A key term associated with the Cox model is the Proportional Hazards Assumption.
This simply is an assumption that states that the hazard ratios between two individuals in the study (relative risk or h(t)/h0(t)
) are constant over time throughout the study period.
Next, the βp
or the coefficients associated with the covariates are estimated using maximization of the Cox proportional hazards partial likelihood function (logarithm of it is shown below).

where:
z
represents the covariate variables (this is equivalent toX
in the previous formula)δ
is the event indicator that is1
if the event occurred (i.e. death) or0
which indicates censoring/ survival past the study period without experiencing the eventβ
represents the coefficients for the covariatesR(t(i))
is the risk set at the timet(i)
Things might be pretty confusing at this point, so let me give you a practical example.
The following is a mock dataset of 100 patients (shown 5, below) with Pancreatic cancer enrolled in a study that is being done to evaluate the effectiveness of a new Drug X.
Patient_ID Survival_Time Treatment Age Cancer_Stage Event_Status
1 56.31 0 53.2 4 1
2 361.21 1 62.3 3 1
3 158.01 0 62.9 3 0
4 109.55 1 52.9 4 1
5 20.35 1 78.7 3 0
...
The variables here are:
Patient ID
Survival time (in days)
Treatment is
1
if the patient received the drug and0
if they were in the control groupAge of the patient
Cancer staging (
3
and4
represent advanced disease)Event status is
1
if the patient did not survive and0
if censored
I am using the lifelines
Python library to analyse this survival data and the steps are documented in this Google Colaboratory notebook.
The results of the analyses are shown here —
coef exp(coef) se(coef) coef lower 95% coef upper 95% exp(coef) lower 95% exp(coef) upper 95% cmp to z p -log2(p)
Treatment -0.113527 0.892680 0.265144 -0.633199 0.406146 0.530891 1.501022 0.0 -0.428170 0.668528 0.580941
Age 0.001061 1.001062 0.014768 -0.027884 0.030006 0.972501 1.030461 0.0 0.071850 0.942722 0.085096
Cancer_Stage -0.341446 0.710742 0.272649 -0.875828 0.192936 0.416517 1.212805 0.0 -1.252328 0.210450 2.248449
When interpreting the results, we mainly look at the following headings —
Hazard Ratios (
exp(coef)
): A ratio above1
indicates increased risk and below1
indicates a lowered risk.
The hazard ratio (0.892680
) for ‘Treatment’ is less than 1
and indicates that it decreases the risk of death.
Coefficients (
β
): These tell the direction and magnitude of influence on the hazard/ effect of each covariate.
A negative β
for ‘Treatment’ tells that it reduces the hazard rate or increases survival.
A positive β
for ‘Age’ tells that it increases the hazard rate or is associated with poor survival.
p-value: Tells if the effects are statistically significant or not
In our data, all of the results are not statistically significant since their value is more than 0.05
.
Confidence Intervals (CI): A 95% CI is supposed to contain the true value of the hazard ratio 95% of the time.
A narrow CI indicates a more precise estimate of the hazard ratio and vice versa.
Also, if the 95% CI doesn’t contain 1
(called that no-effect value), the results are supposed to be statistically significant.
In our data, the 95% CI for all exp(coef)
indicate that the results are not statistically significant.
Hope things are clear now! Let’s return to the AI model.
The Cox model was adopted in the prediction branch of the neural network as the Survival loss (L(s)
) as shown below —

where W'
is a weight vector applied to the latent representation ϕ(x)
to produce a scalar value (W'ϕ(x(i)))
which represents the survival prediction or estimate of the log hazard ratio for a subject i
.
Combining both the losses (Reconstruction & Survival loss) leads to the overall loss (L(hybrid)
) used by the 4DSurvival model.

This loss function is minimized using backpropagation with L1 Regularization and the Adam optimizer.
The overall architecture of the 4DSurvival model is shown below.

Hyperparameter Tuning With Particle Swarm Optimization (PSO)
The model’s hyperparameters were tuned by a technique called Particle Swarm Optimization (PSO).
This is an interesting optimization method inspired by the social foraging behaviour of birds.
It works on the principle of Swarm Intelligence that involves a population (called Swarm) consisting of different solutions (called Particles) to the problem of interest.
The particles or solutions move around/ “fly” in a search space based on mathematical formulae.
These movements are guided by the particles’ own as well as the entire swarm’s best-known positions to reach the best possible solution.
Think of a simple example where a swarm of birds are trying to look for food in an area.
Using PSO, they will rely on their own experience as well as communicate with their peer birds to estimate where the food could be.
Accordingly, they will adjust their flying till they reach the place where food is located.

Similarly, for the model, PSO was used to choose the best set of hyperparameters from among predefined ranges of values.
Results Based On Harrell’s Concordance Index
The model’s predictive accuracy was evaluated using Harrell’s concordance index (C-index), which is an extension of the Area under the ROC curve (AUC) for censored time-to-event data.
A C-index of 0.5
suggests random guessing, whereas a value of 1.0 indicates the perfect predictive ability of the model.
Thus, values closer to 1
suggest strong predictive accuracy of the model.
To compare the model with conventional volumetric indices used to estimate survival in patients with RV dysfunction, another Cox proportional hazards model was utilized using these indices.
The C-index of the model was 0.73
as compared to the conventional model with a C-index of 0.59
, with a statistically significant result.
Visualising Latent Space with Laplacian Eigenmaps
To understand things better, the latent space created by the model was visualised by using a non-linear dimensionality reduction technique called Laplacian Eigenmaps.
This technique reduces the high dimensional latent space into two dimensions, preserving the intrinsic geometrical relationships between different data points (unlike traditional linear methods like PCA (Principal Component Analysis)
(A similar dimensionality reduction technique is described in one of my previous articles linked here.)

Studying The Effects Of Different Areas of RV on Survival Prediction
The researchers further noted the mean displacement of each point on the right ventricle (RV) and combined it with the predicted survival risk from the network, using a Linear Regression model.
The obtained regression coefficient for each point quantifies how much the motion of that area of the RV contributes to patient survival.
The logarithms of these coefficients were put on the 3D structure of the RV to create a 3D saliency map that showed the contribution of different regions of the RV in influencing survival.

Further Reading
Pre-print version of the research paper titled ‘Deep learning cardiac motion analysis for human survival prediction’ in Arxiv
Research paper titled ‘Deep-learning cardiac motion analysis for human survival prediction’ published in Nature Machine Intelligence journal
AI is transforming healthcare and helping humans live longer.
Do you know of more such important research or are you working on some? Let me know in the comments below!
I can look at your large box of donuts and do the same :)