

Your First Hands-On Lesson On Using AlphaFold
A practical lesson on folding proteins using AlphaFold (and more!)


Google’s AlphaFold 3 is an incredible AI model that can predict the structure and interactions of all life’s molecules (proteins, DNA, RNA, ligands and more).
This model is so marvellous that its creators, Demis Hassabis and John Jumper, were awarded the Nobel Prize in Chemistry in 2024.
While most tutorials focus on the inner workings of the model, we will take a different approach and focus on learning how to use it and interpret the results.
Let’s begin with your first lesson on using AlphaFold!
Time For Some Biology First
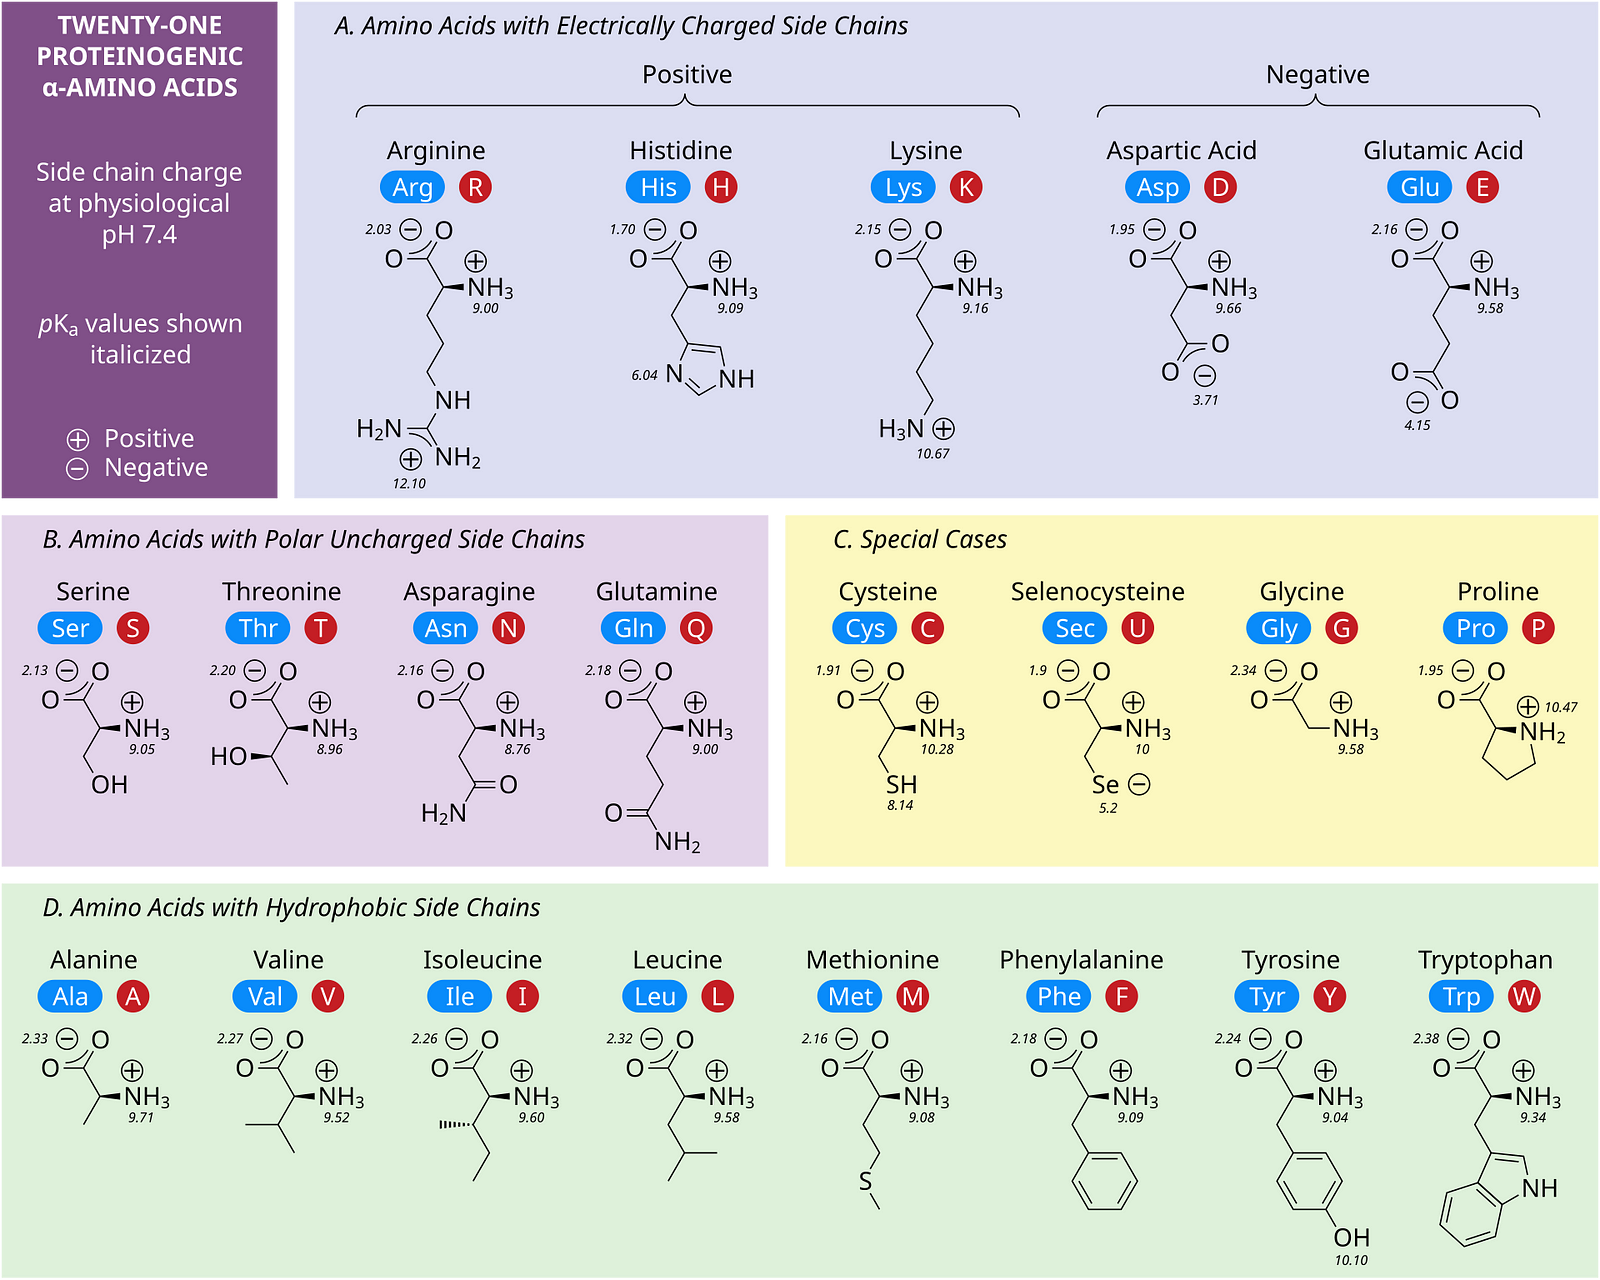
Proteins are large biomolecules that perform a wide range of functions in all organisms, making life possible.
They are formed of different amino acids, as shown in the image below.
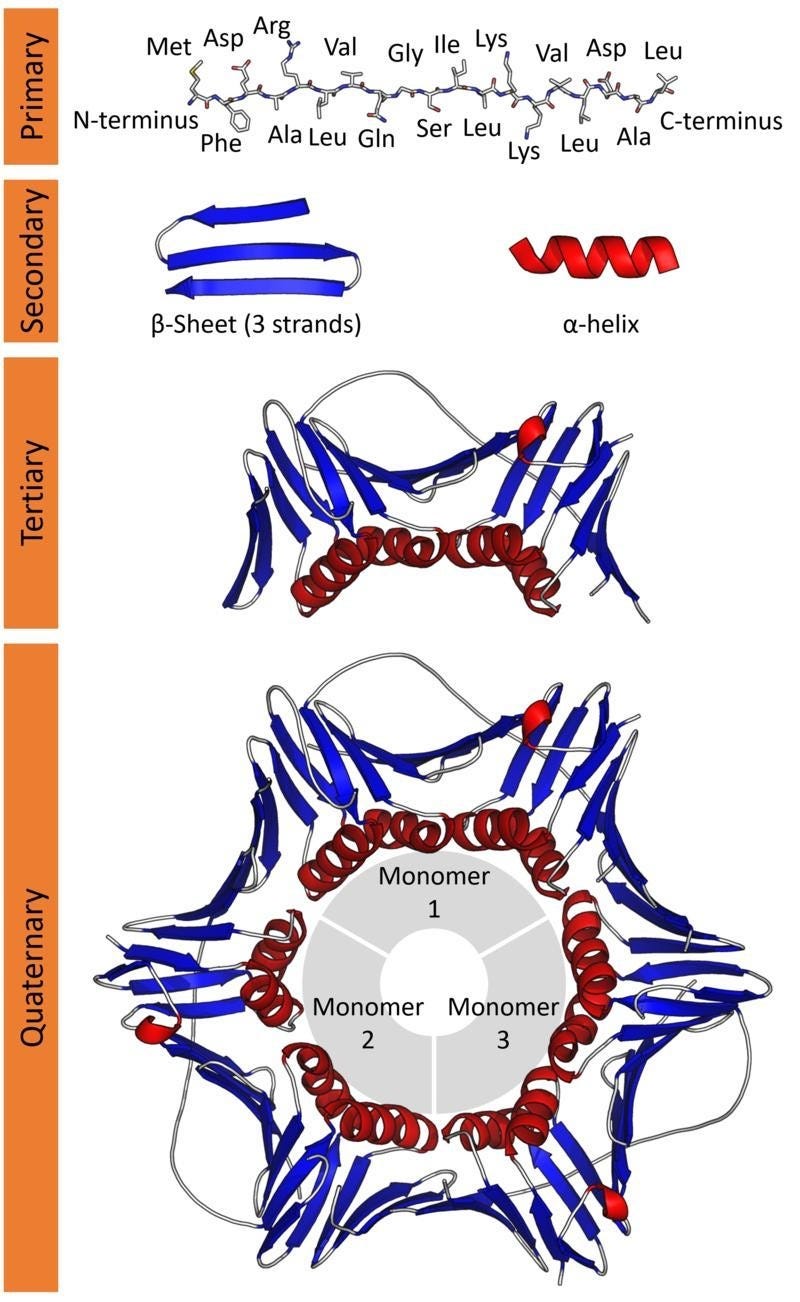
These amino acids connect together, forming long chains (just like beads in a string). This is the Primary structure of a protein.
This structure folds further in helical and sheet-like appearances called α-helix and the β-sheets, respectively. This is the Secondary structure of a protein.
This further folds up into a compact globular structure called the Tertiary structure of a protein.
Lastly, many Tertiary subunits can come together to form the Quarterny structure of a protein.
It is this Tertiary/ Quaternary structure of a protein that gives rise to its function.
Moving forward!
In 1972, Christian Anfinsen won the Nobel Prize in Chemistry for proposing that a protein’s structure is determined by the sequence of amino acids that make it up.
This is called the Anfinsen’s dogma.
This means we could find a protein's biologically active structure if we know its primary structure (i.e., the chain of amino acids that make it up).
(The primary structure of a protein is easy to find using biochemical amino acid sequencing techniques.)
Unfortunately, although possible and as easy as it might seem, predicting a protein's tertiary/quaternary structure is extremely challenging, given its primary structure.
This difficulty is well described by Cyrus Levinthal, a molecular biologist, who found that an unfolded protein chain can fold in 10³⁰⁰ possible conformations.
If a protein were to reach its correctly folded structure by sequentially sampling all the possibilities, it would take longer than the age of the universe.
However, most proteins fold by themselves in a time scale of microseconds to milliseconds. This is known as known as Levinthal’s paradox.
Does this mean that we can’t find the 3D structure of a protein at all?
This is not true.
Biologists have long used the following techniques to find the 3D structures of proteins:
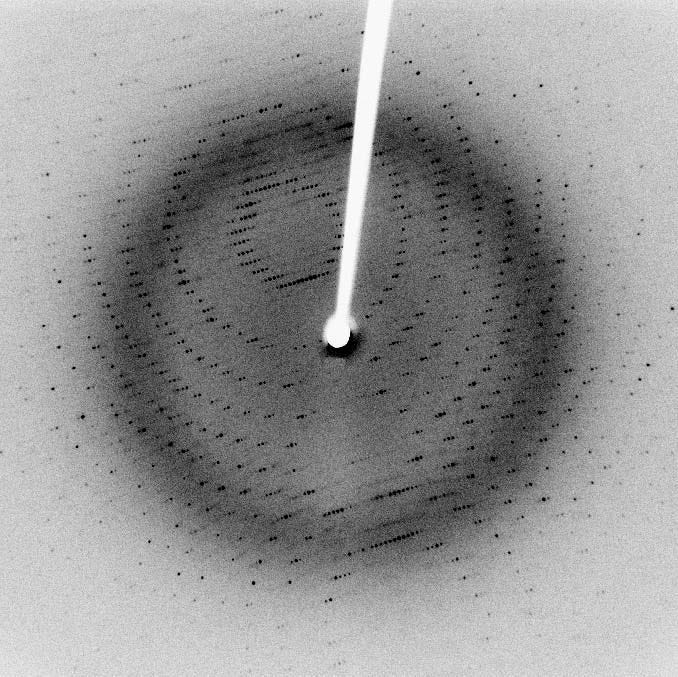
X-ray crystallography, where the diffraction pattern of X-rays passed through the crystal, is studied to produce its 3D structure.
Nuclear magnetic resonance (NMR) spectroscopy, where the magnetic properties of a protein’s atoms are used to determine its 3D structure
Cryo-electron microscopy, where frozen protein crystals are viewed using an Electron microscope
But these techniques are slow and can take even decades just for a single protein!
To find solutions to this problem, a worldwide experiment for protein structure prediction called Critical Assessment of Structure Prediction (CASP) is conducted every two years.
Really smart participants are invited here to submit structures for a set of proteins for which the experimental structures are known but have not yet been released to the public.
Usually, the winning models of this competition have been pretty mediocre, but a team of researchers at Google DeepMind, along with their AlphaFold AI model, dramatically changed this in 2018.
They then improved their model, which they named AlphaFold2 and won the competition again in 2020 by a huge margin.
This was when CASP organisers declared that the protein structure prediction problem “has been largely solved for single proteins”.
In 2021, the team published their model in the Nature Journal and open-sourced its code.
By early 2022, they had released a public database of nearly one million protein structures that anyone could access for free on the Internet.
This was soon expanded to over 200 million structures (including multimeric proteins) that cover nearly all catalogued proteins known to science.
In 2024, AlphaFold 3 was released, which was much more accurate and could predict structures and interactions of a wide range of biomolecules, including DNA, RNA, ligands, small molecules and, yes, proteins.
There are a lot of interesting deep-learning approaches used in AlphaFold, and here’s an introduction to them.
However, since this is supposed to be a hands-on tutorial, we will skip these details and move on to get our hands dirty with some practical examples.
Folding Our First Protein With AlphaFold
There are a lot of proteins that are crucial for human survival, and you’re free to pick one of your choice.
I will pick Myoglobin, a protein found in muscle that stores oxygen and helps supply it to muscles, especially during intense activity.
We start our journey with UniProt, which is a comprehensive database of protein sequences and their functions.
We search for the term ‘Myoglobin’ here.
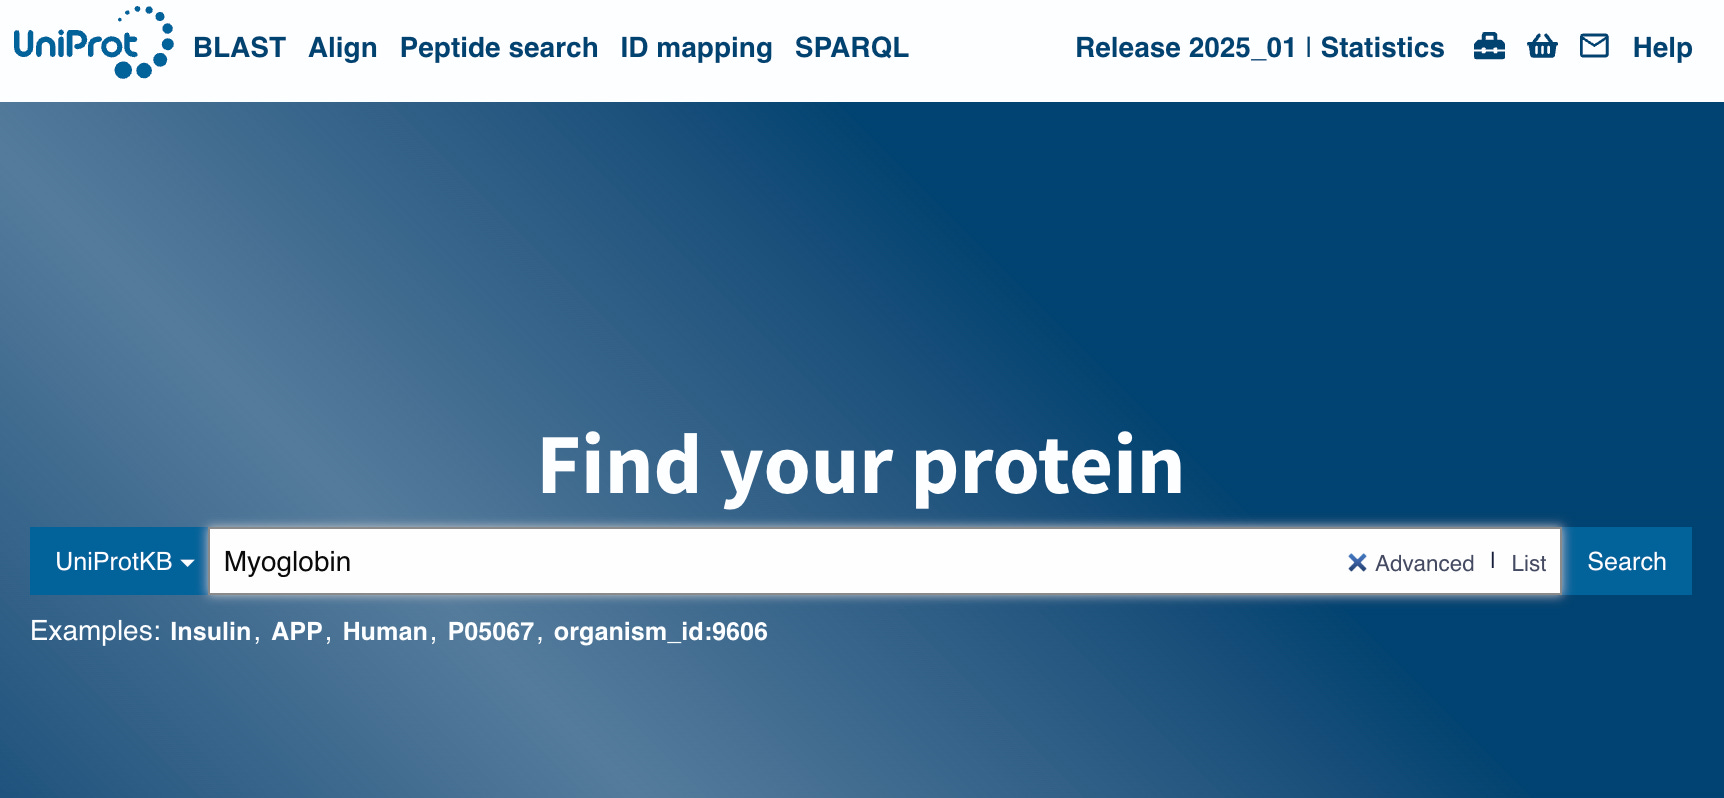
This search returns 2395 results for Myoglobin found in all different organisms.
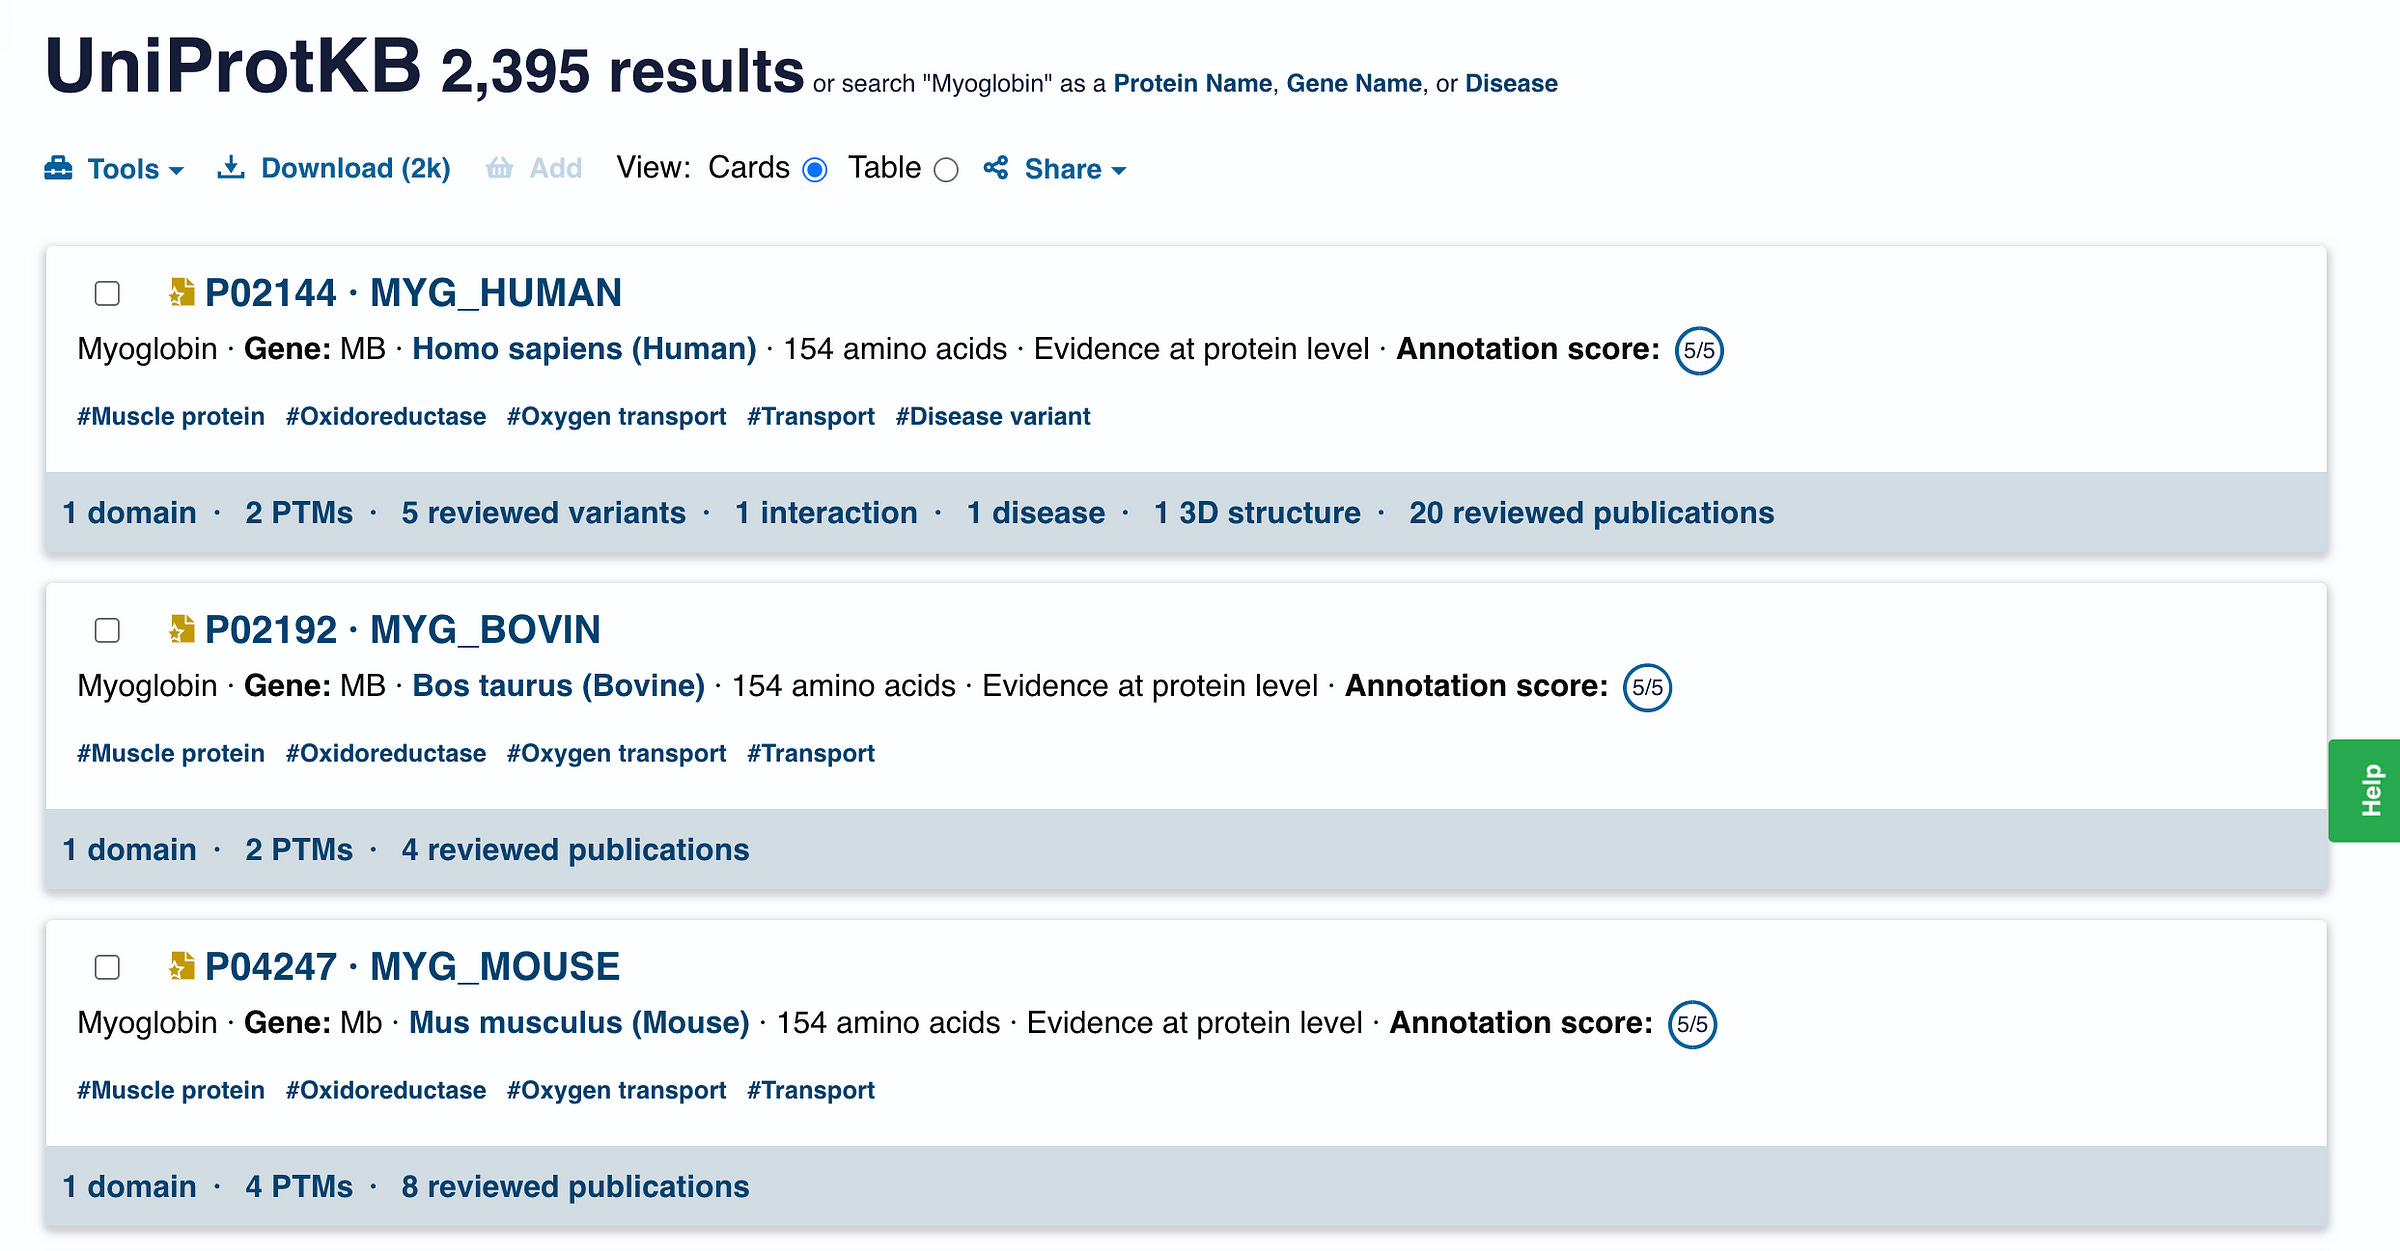
What we are interested in MYG_HUMAN or the human Myoglobin.
Clicking on it gives us all the details about this protein.
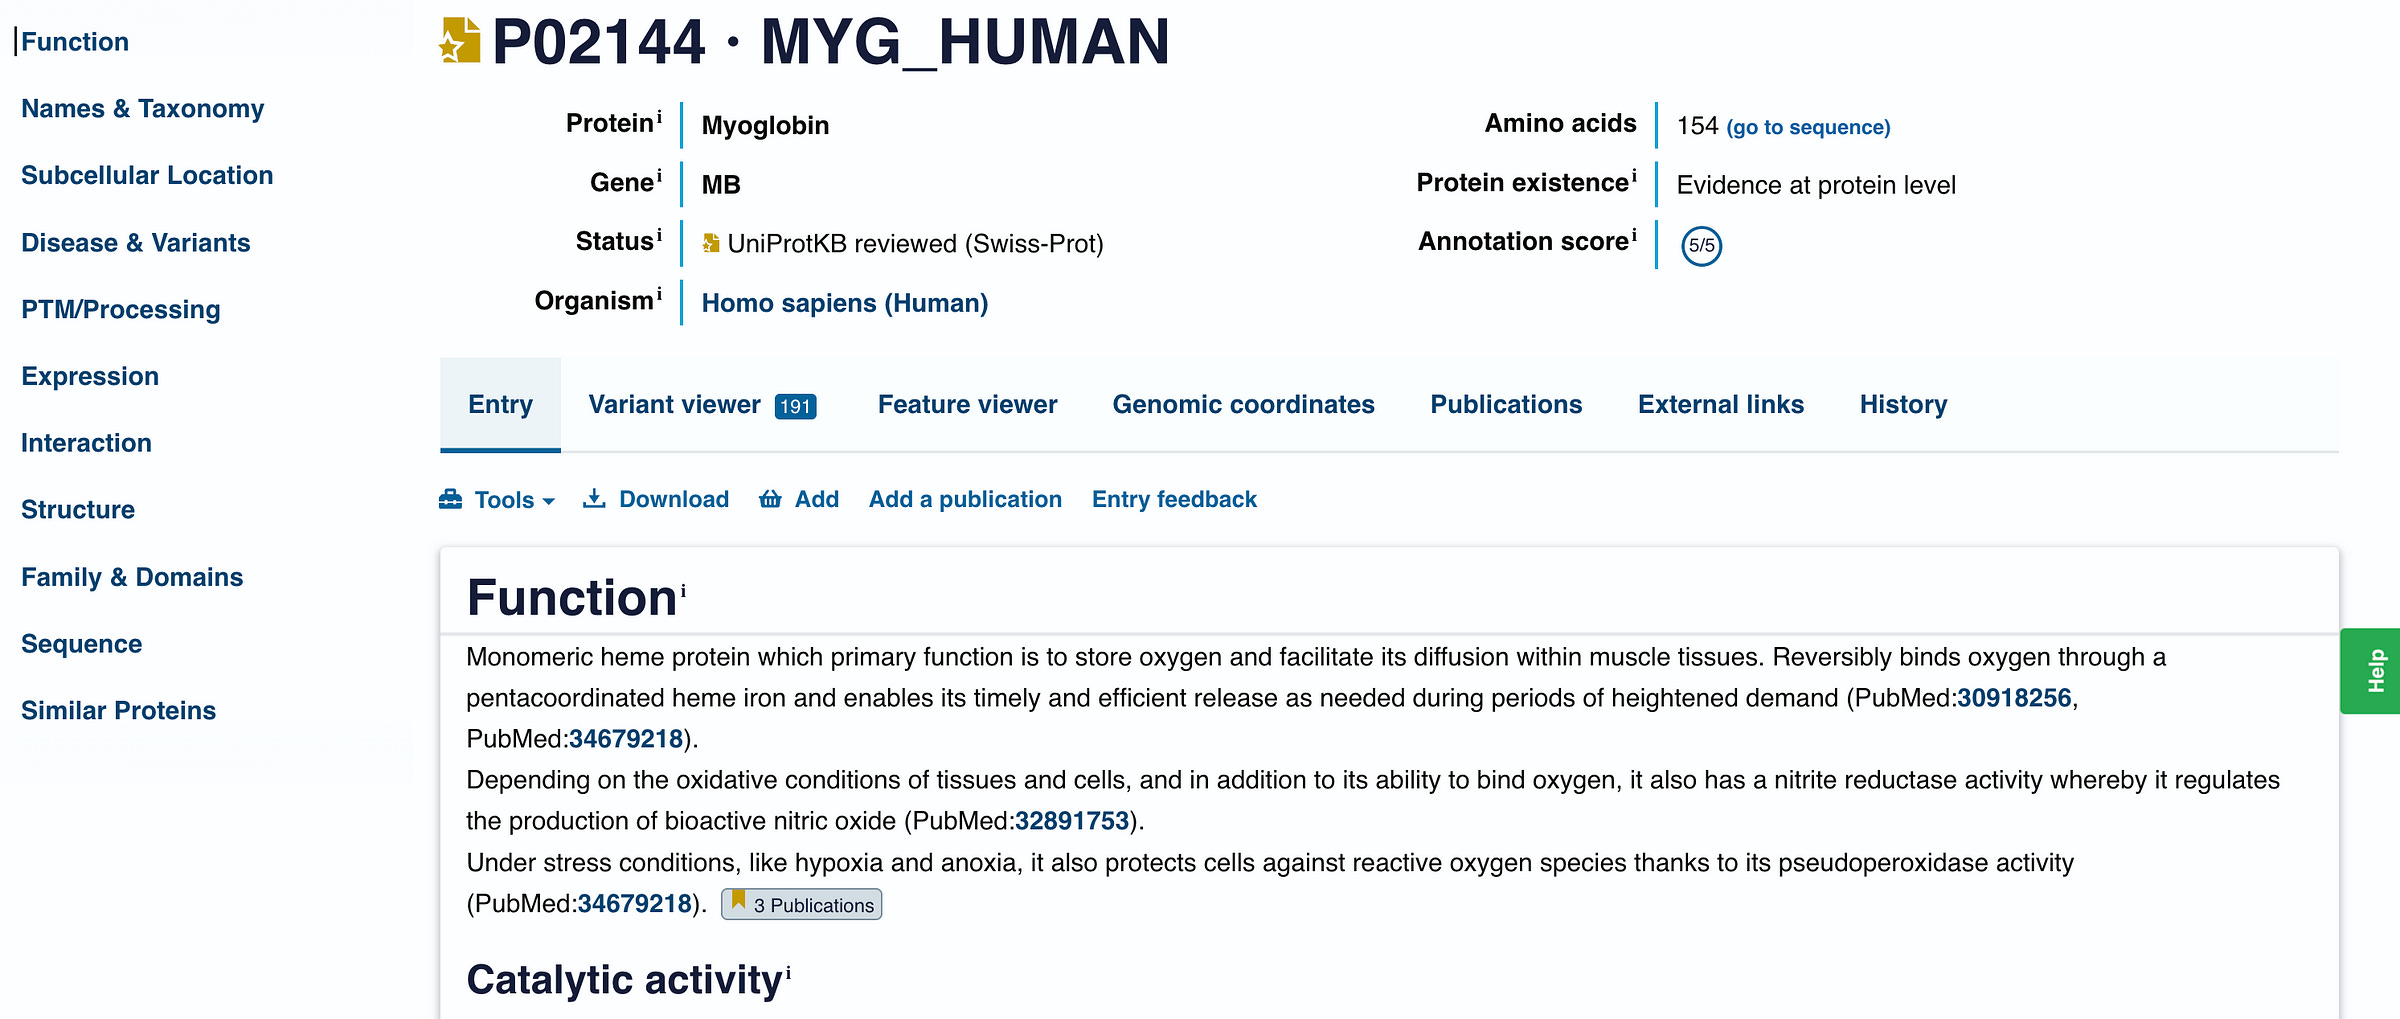
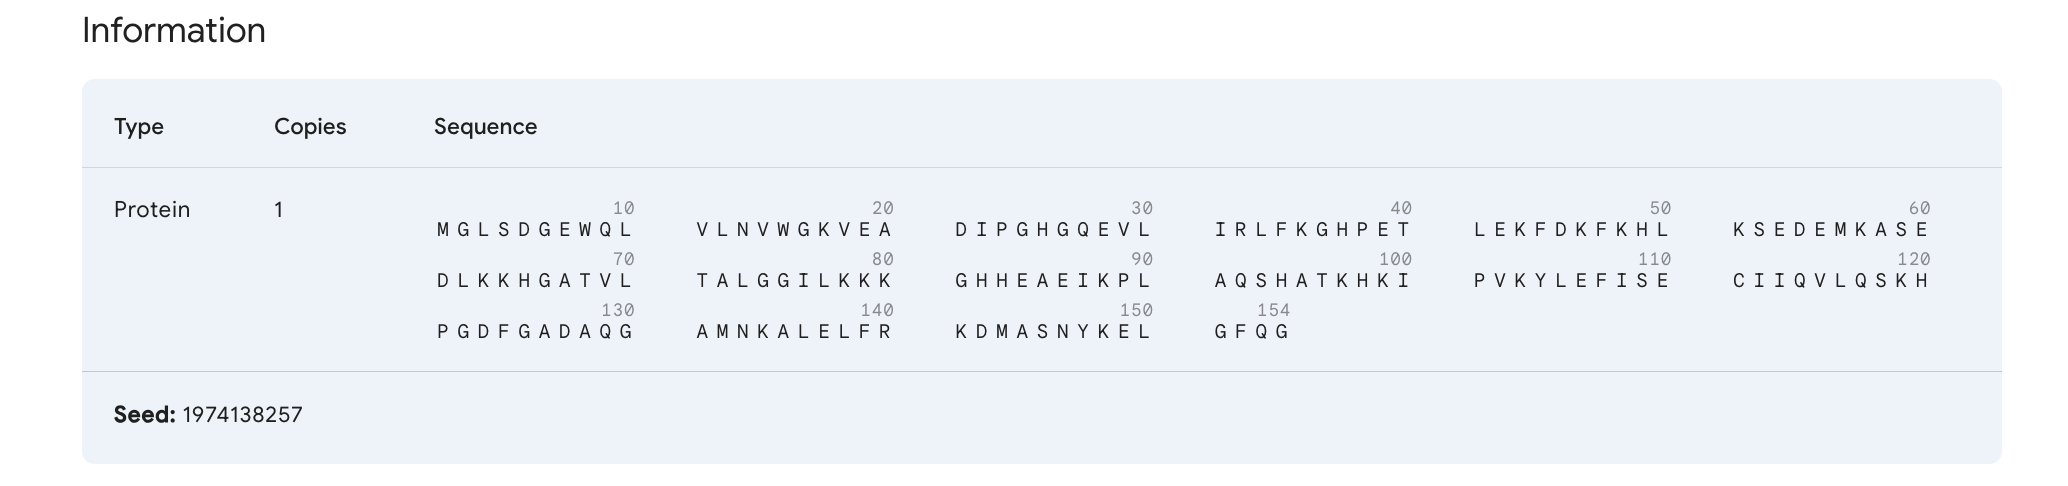
What we are interested in here is the sequence of amino acids that make up this protein (i.e. the primary structure).
We click on the ‘Sequence’ option on the left-hand side menu, which leads to the following:
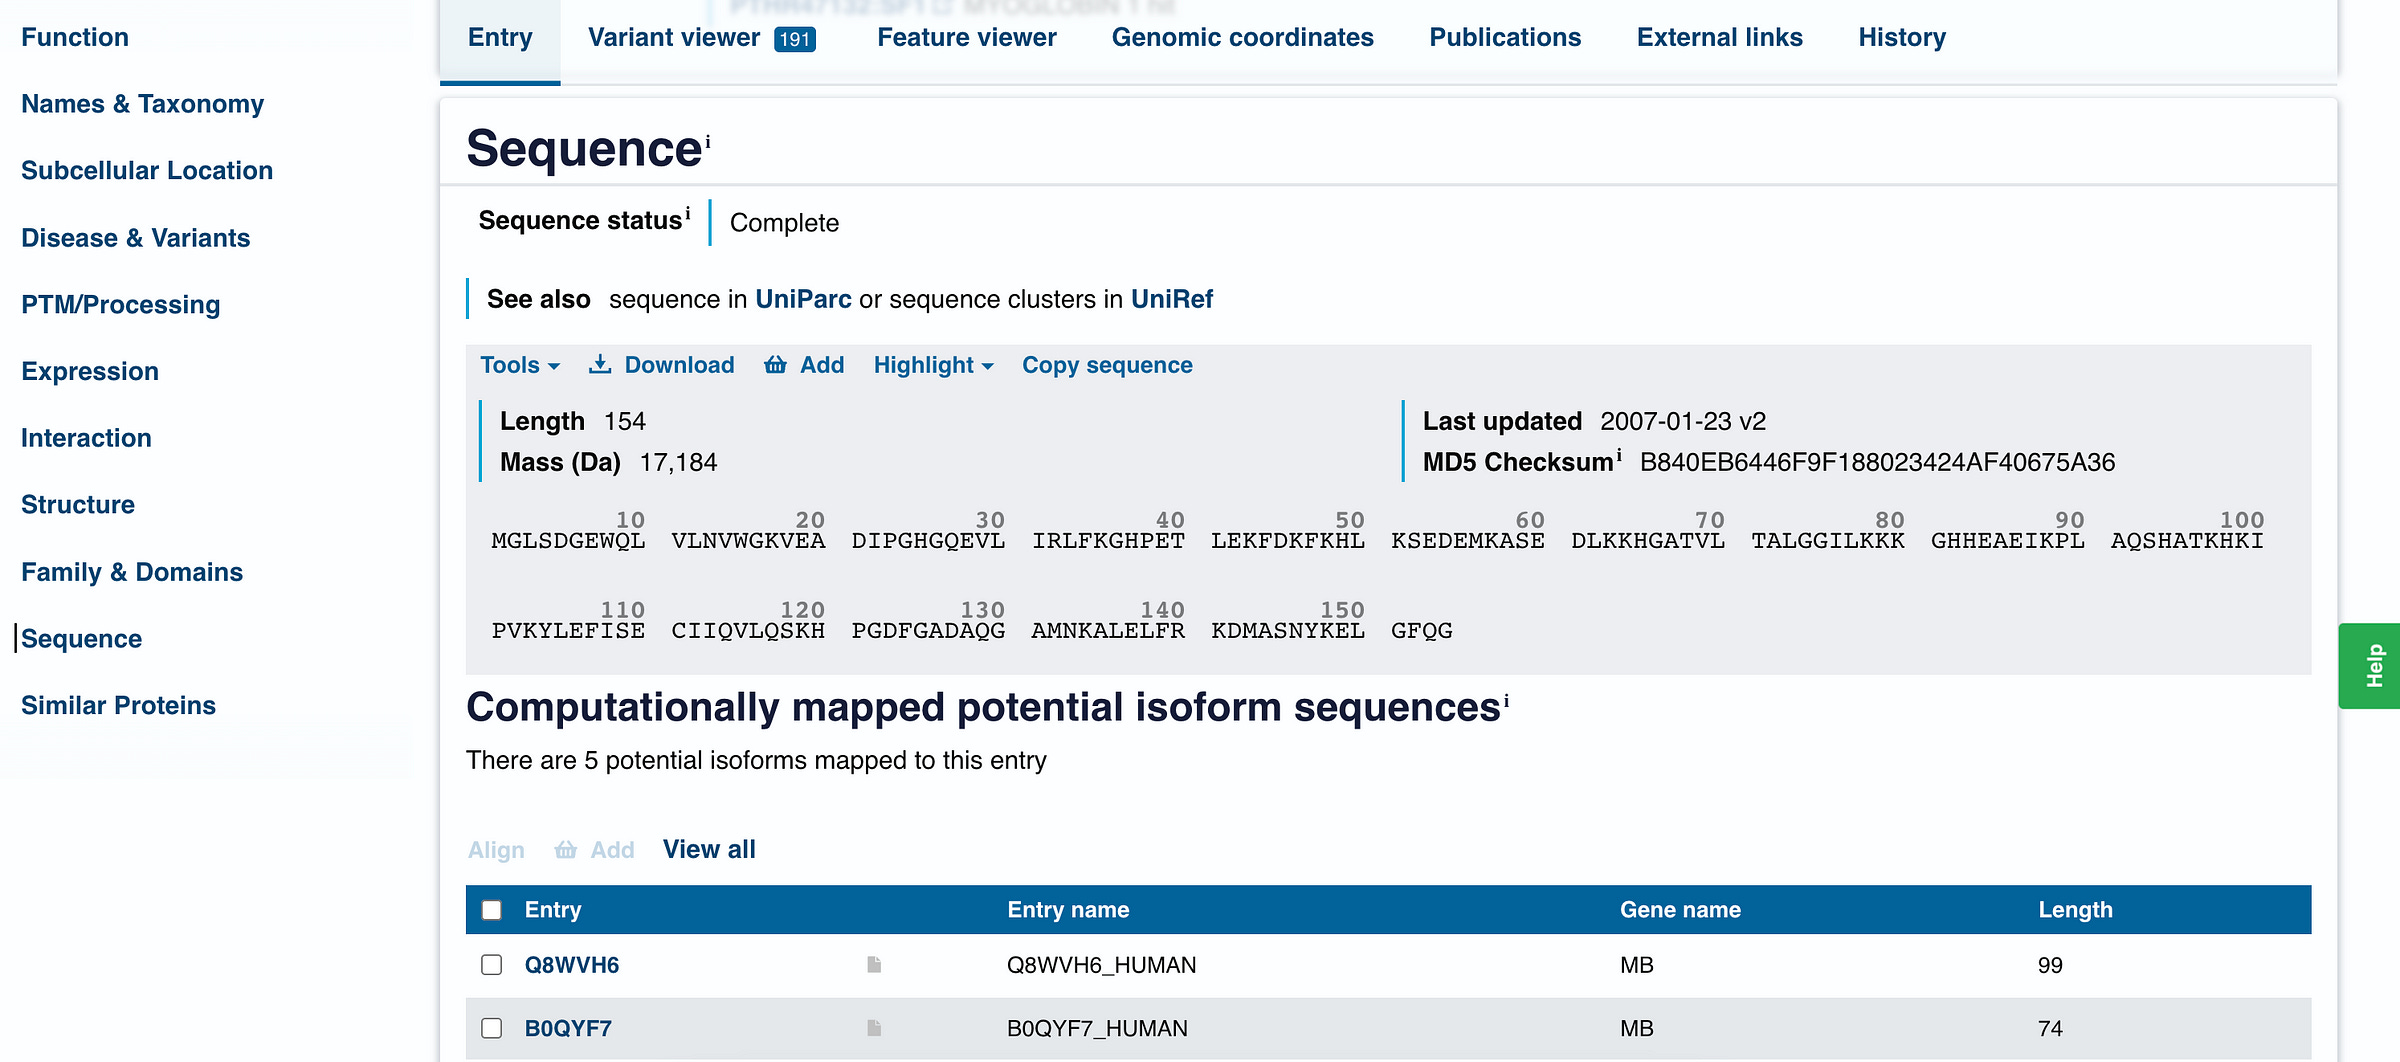
We can tell that human Myoglobin is made up of 154 amino acids (documented as ‘length’) and has a mass of 17,184 daltons, which is quite small compared to big proteins in our body.
Clicking on ‘Download’ leads us to the FASTA file for this protein.
This is a popular text-based format used to store nucleotide and amino acid sequences.
>sp|P02144|MYG_HUMAN Myoglobin OS=Homo sapiens OX=9606 GN=MB PE=1 SV=2
MGLSDGEWQLVLNVWGKVEADIPGHGQEVLIRLFKGHPETLEKFDKFKHLKSEDEMKASE
DLKKHGATVLTALGGILKKKGHHEAEIKPLAQSHATKHKIPVKYLEFISECIIQVLQSKH
PGDFGADAQGAMNKALELFRKDMASNYKELGFQG
The fields in the header that we are interested in are:
P02144is the UniProt accession number.MYG_HUMANis the UniProt entry name whereMYGis for myoglobin andHUMANindicates species.Myoglobinis the protein’s name.OS=Homo sapiensis the Organism species.GN=MBis the Gene name.MBis the gene that encodes myoglobin.
Following this is the sequence of this protein, where each letter is the code for amino acids (M for Methionine, G for Glycine and so on).
Next, we go to the AlphaFold server. This is where we can access AlphaFold3, with a limit of 30 free requests per user.
We paste the sequence from our FASTA file here (which will be automatically structured using a default template).
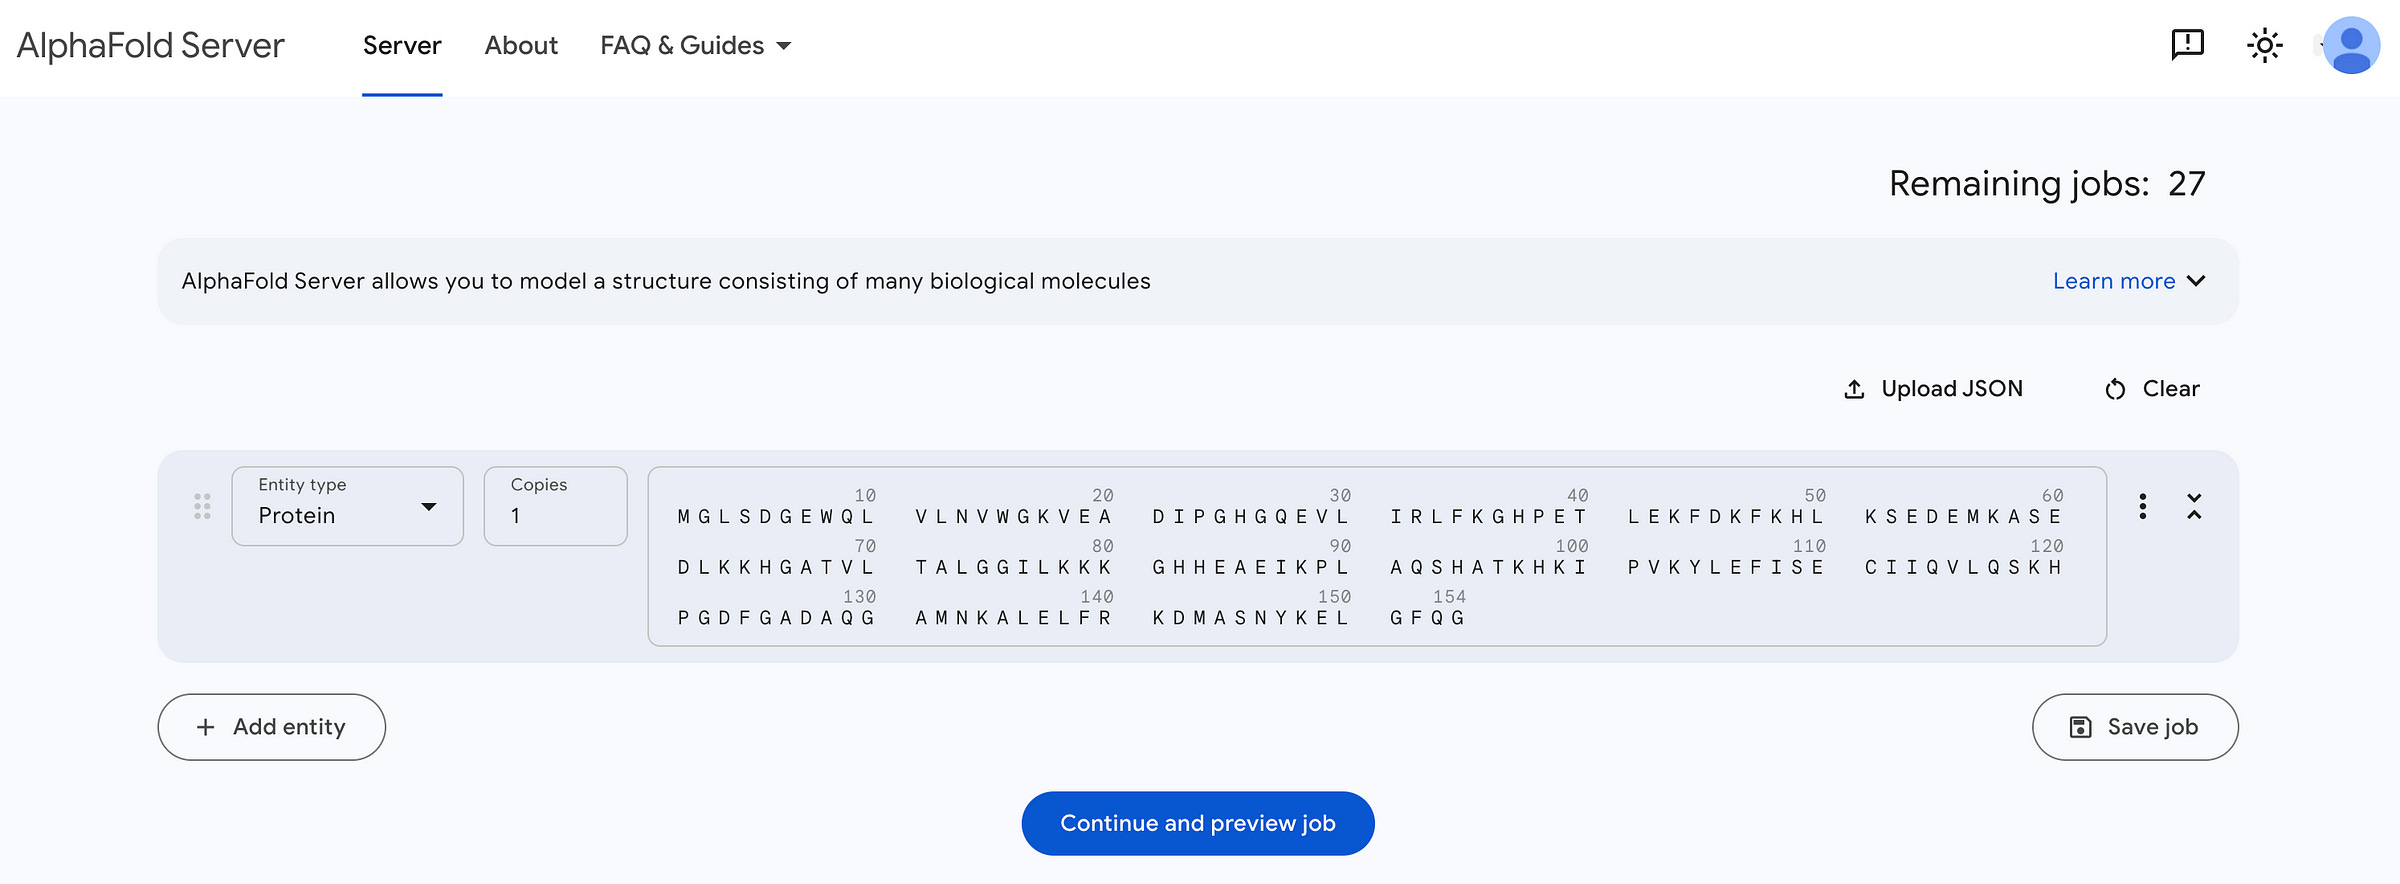
We next proceed to preview the job, which looks like this.
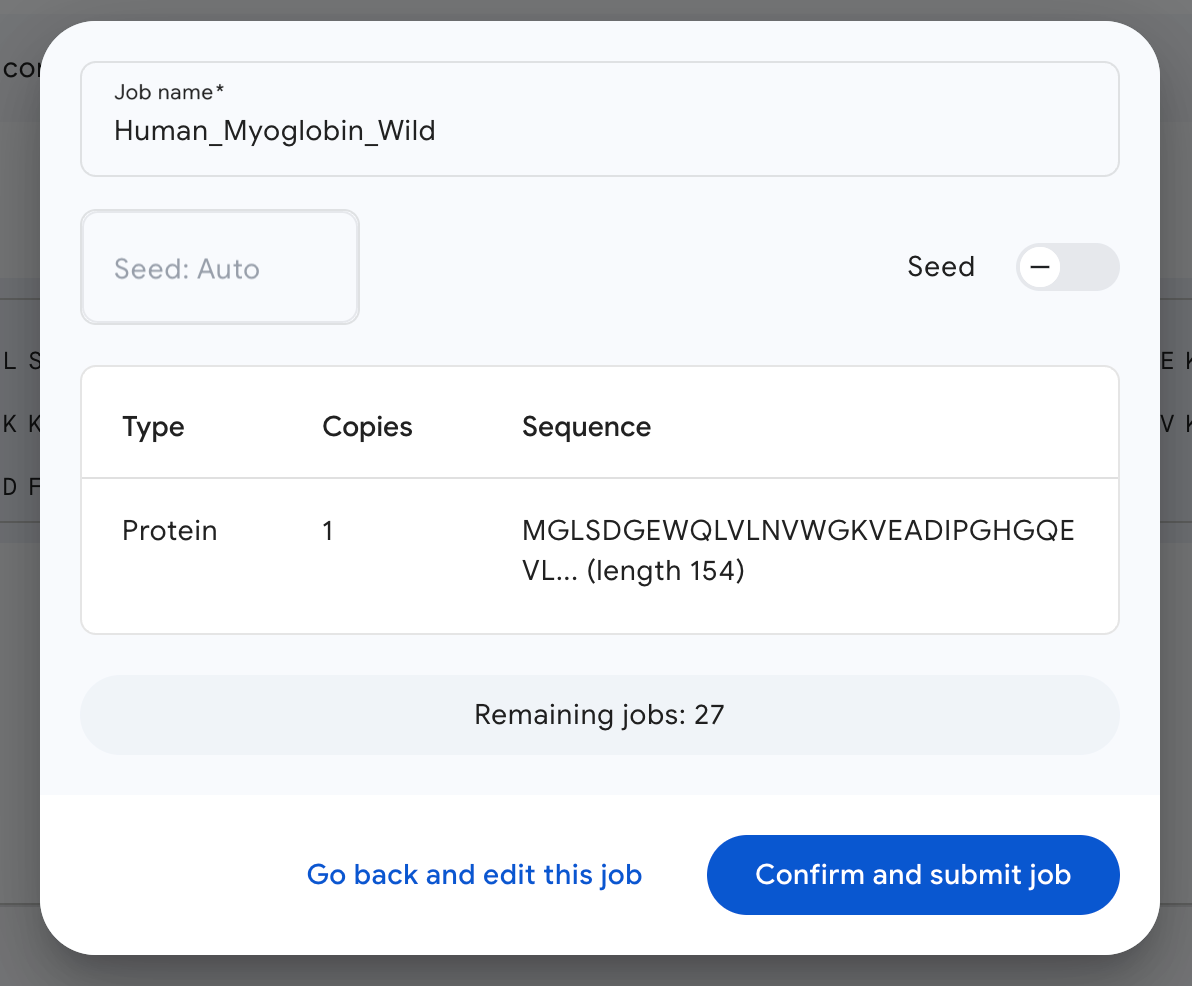
I’ve named the job Human_Myoglobin_Wild, and the seed is set to ‘Auto’ by default.
Then we click on confirm, and we are done!
(For those new to biology, a wild-type protein is the most common form of a protein as it occurs naturally in a population.)
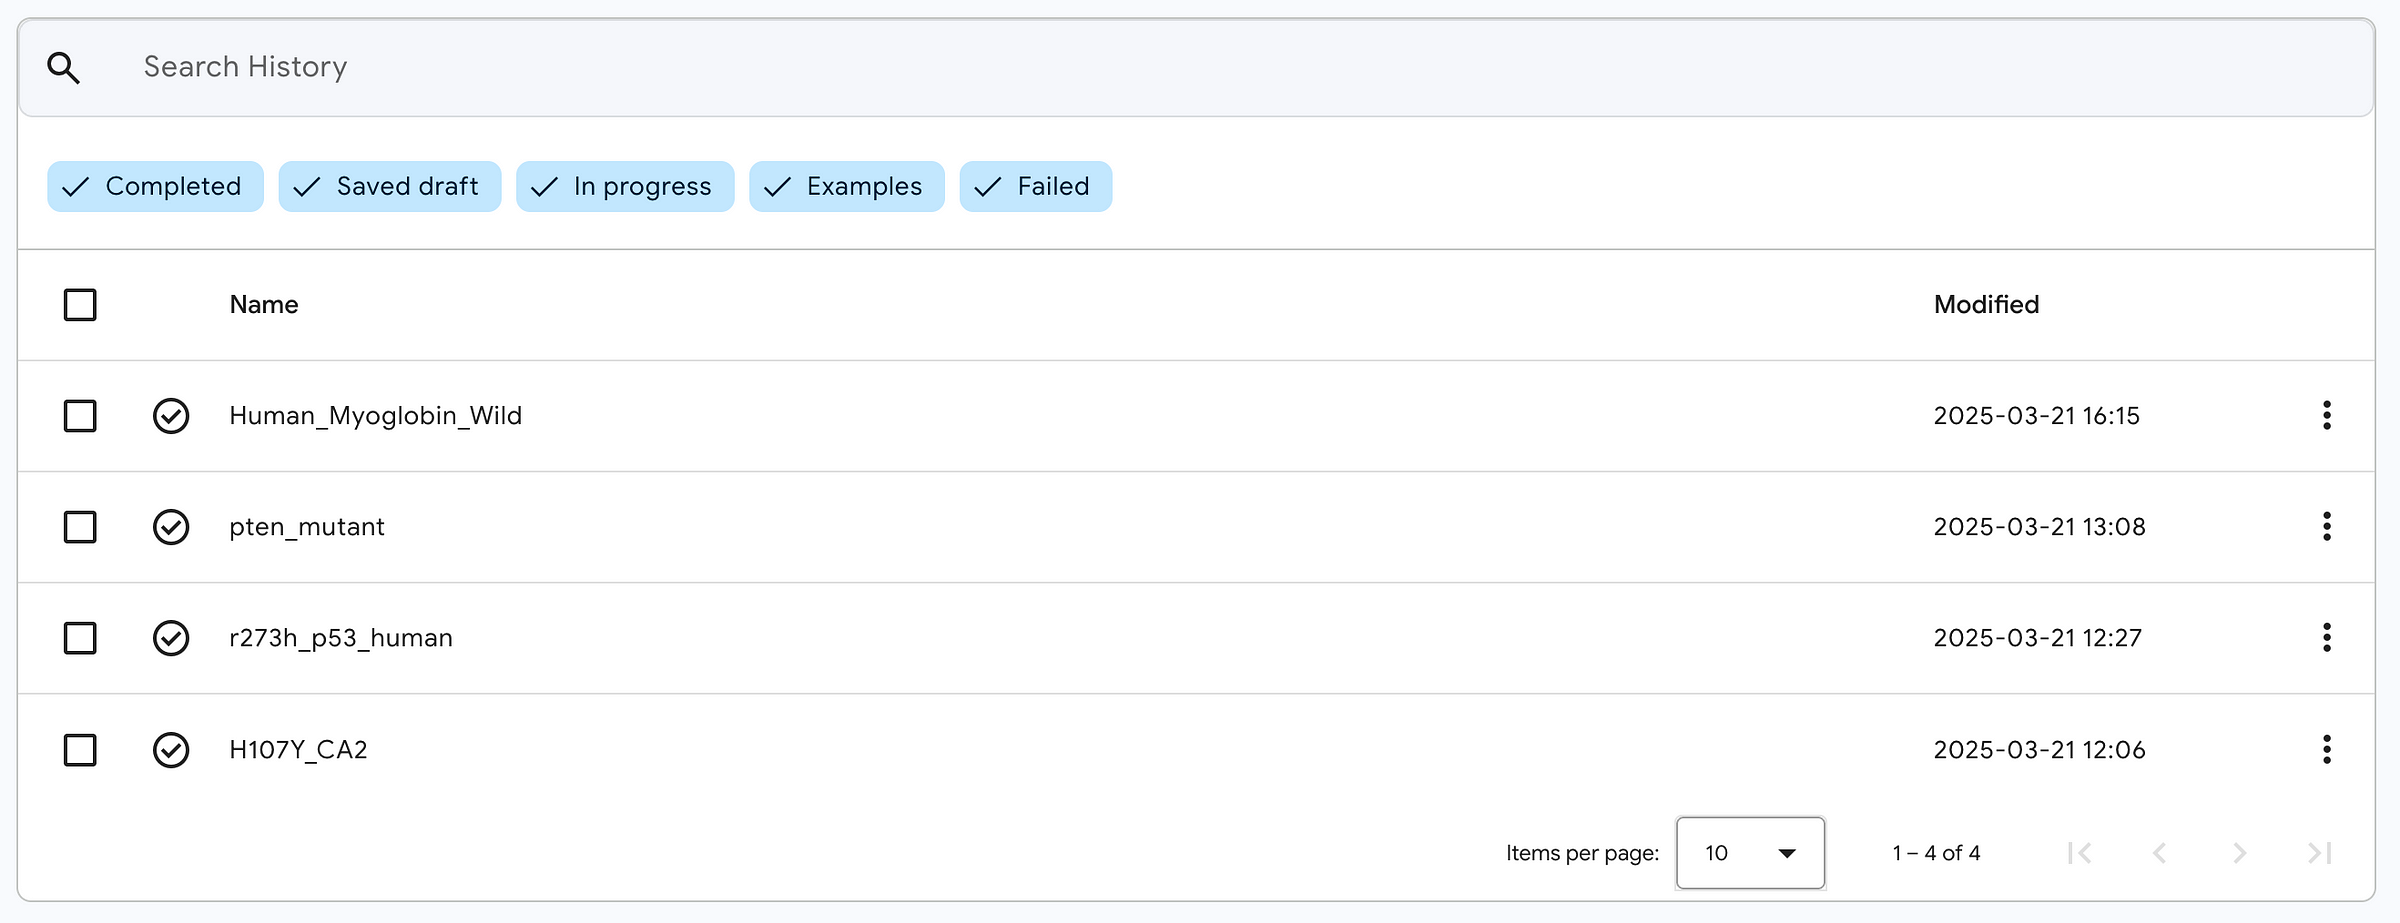
Since this is a small protein, AlphaFold will sequence it pretty quickly (in a few minutes).
Once complete, this will appear in your job history.
Evaluating AlphaFold Results
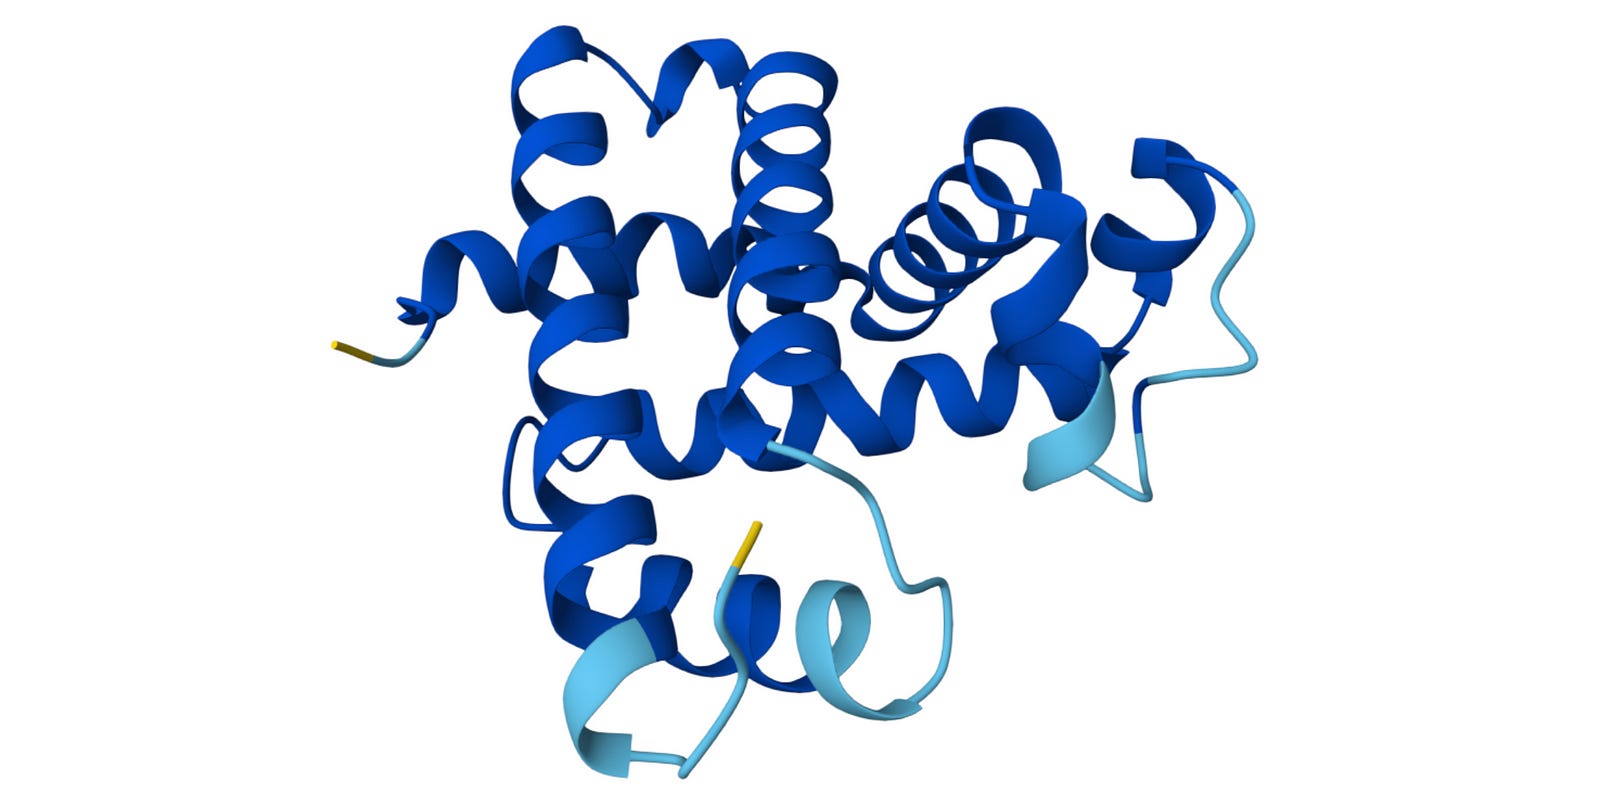
This is what the result page looks like.
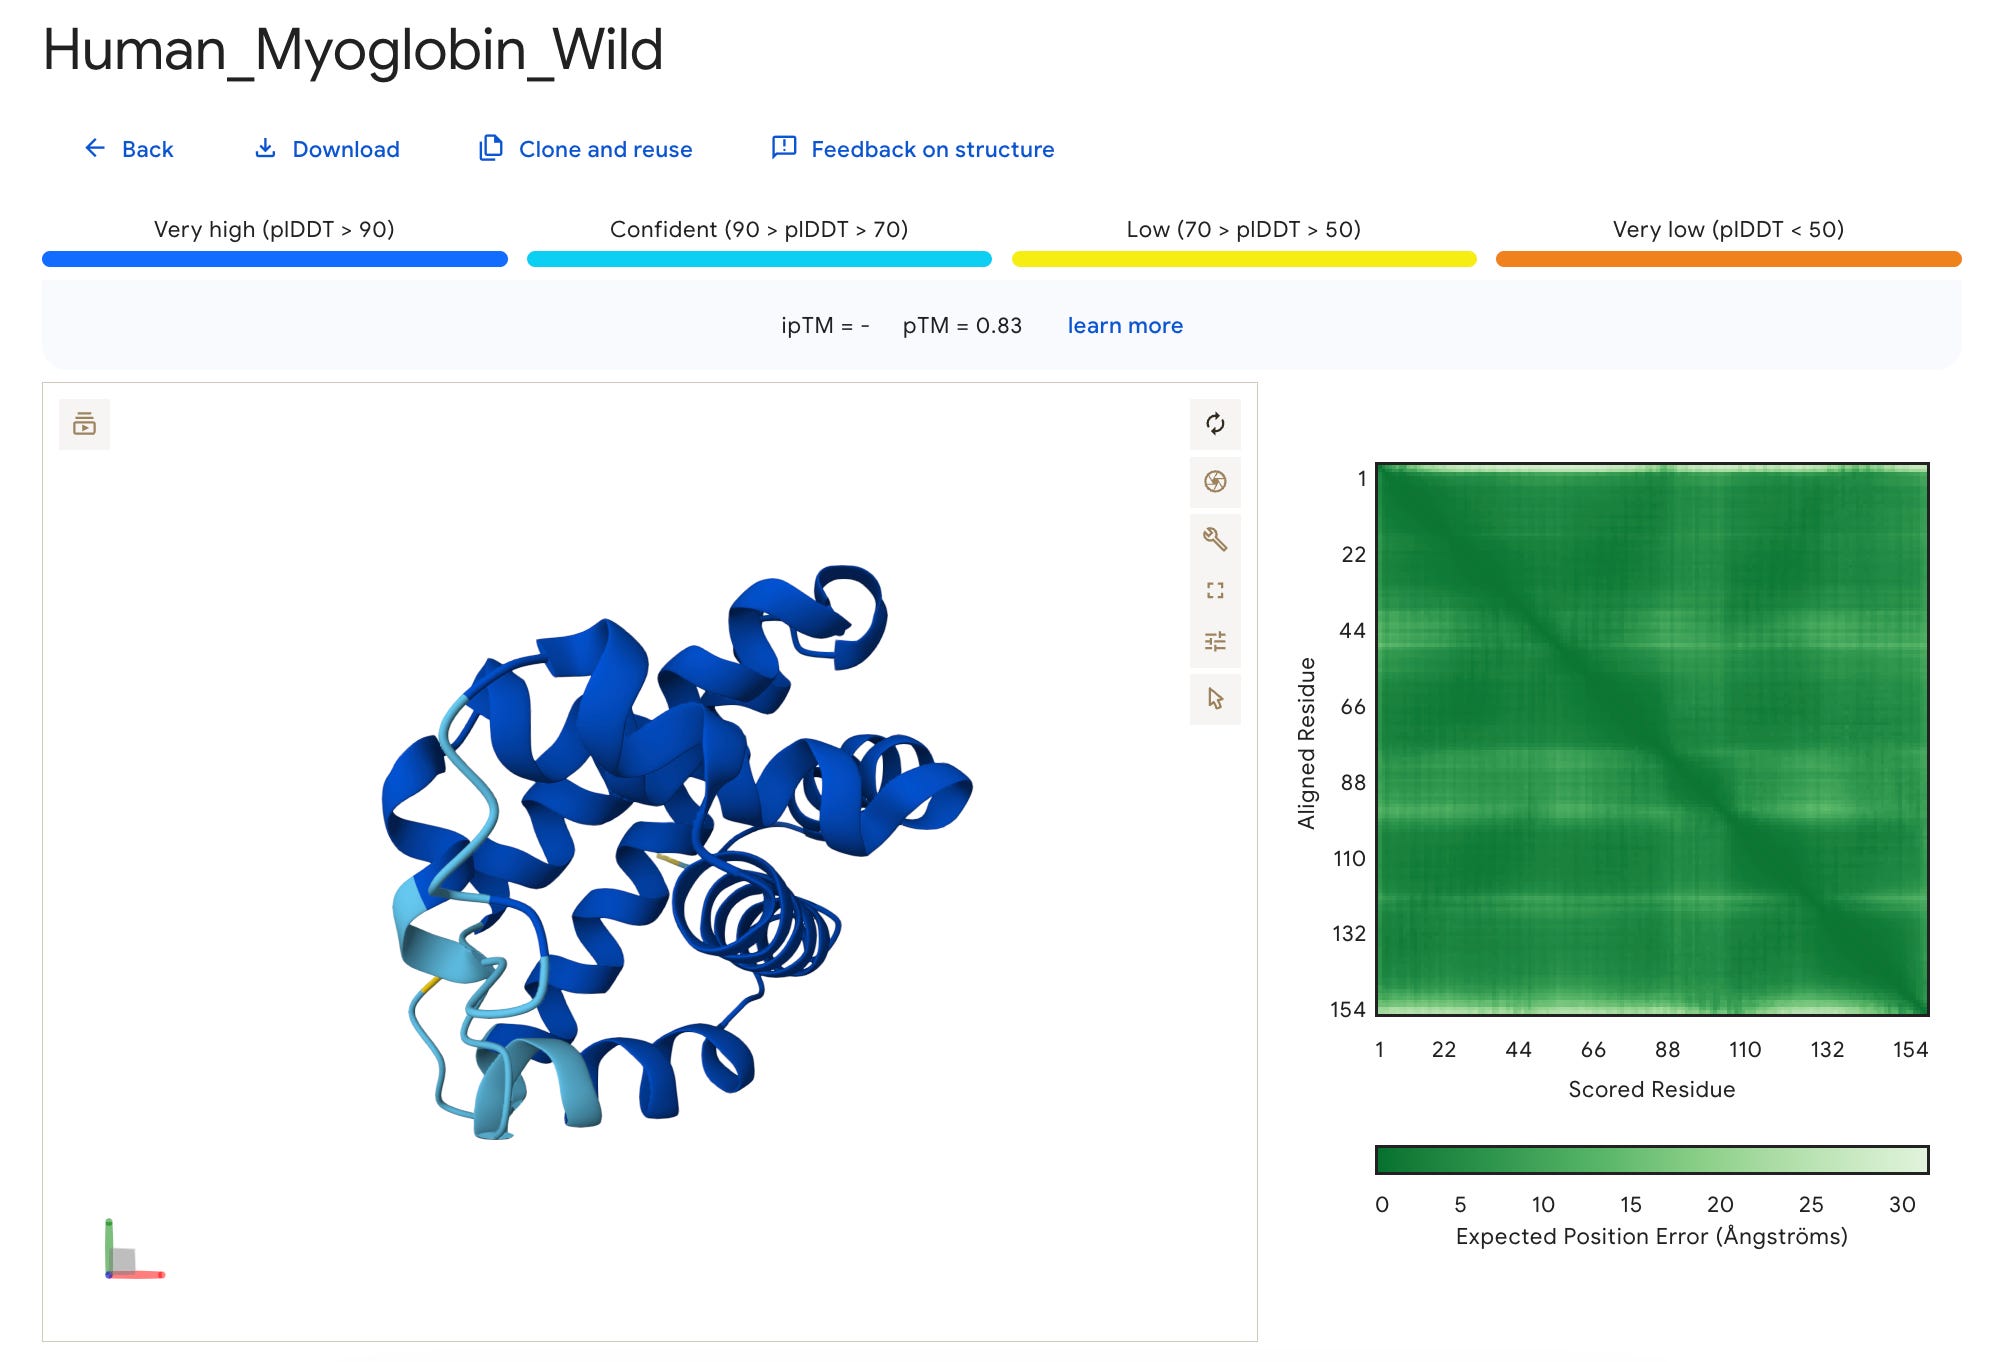
What we have here is a 3D interactive view of the protein that we just folded, along with some metrics, including the sequence and seed used.
Let’s learn what these are.
1. pLDDT (Predicted Local Distance Difference Test)
This estimates how confident the model is in the 3D position of each amino acid.
(Amino acids are fancily called ‘Residue’, and I will sometimes use this term in this article interchangeably.)
It ranges from 0 to 100 and measures the model’s confidence in the local structure, telling how well the prediction would agree with an experimental structure.
We can see that this metric is very high (pLDDT > 90) (shown in dark blue) for most parts of the protein but low (70 > pLDDT > 50) (shown in yellow) for the terminal ends, which are often more flexible and disordered naturally.
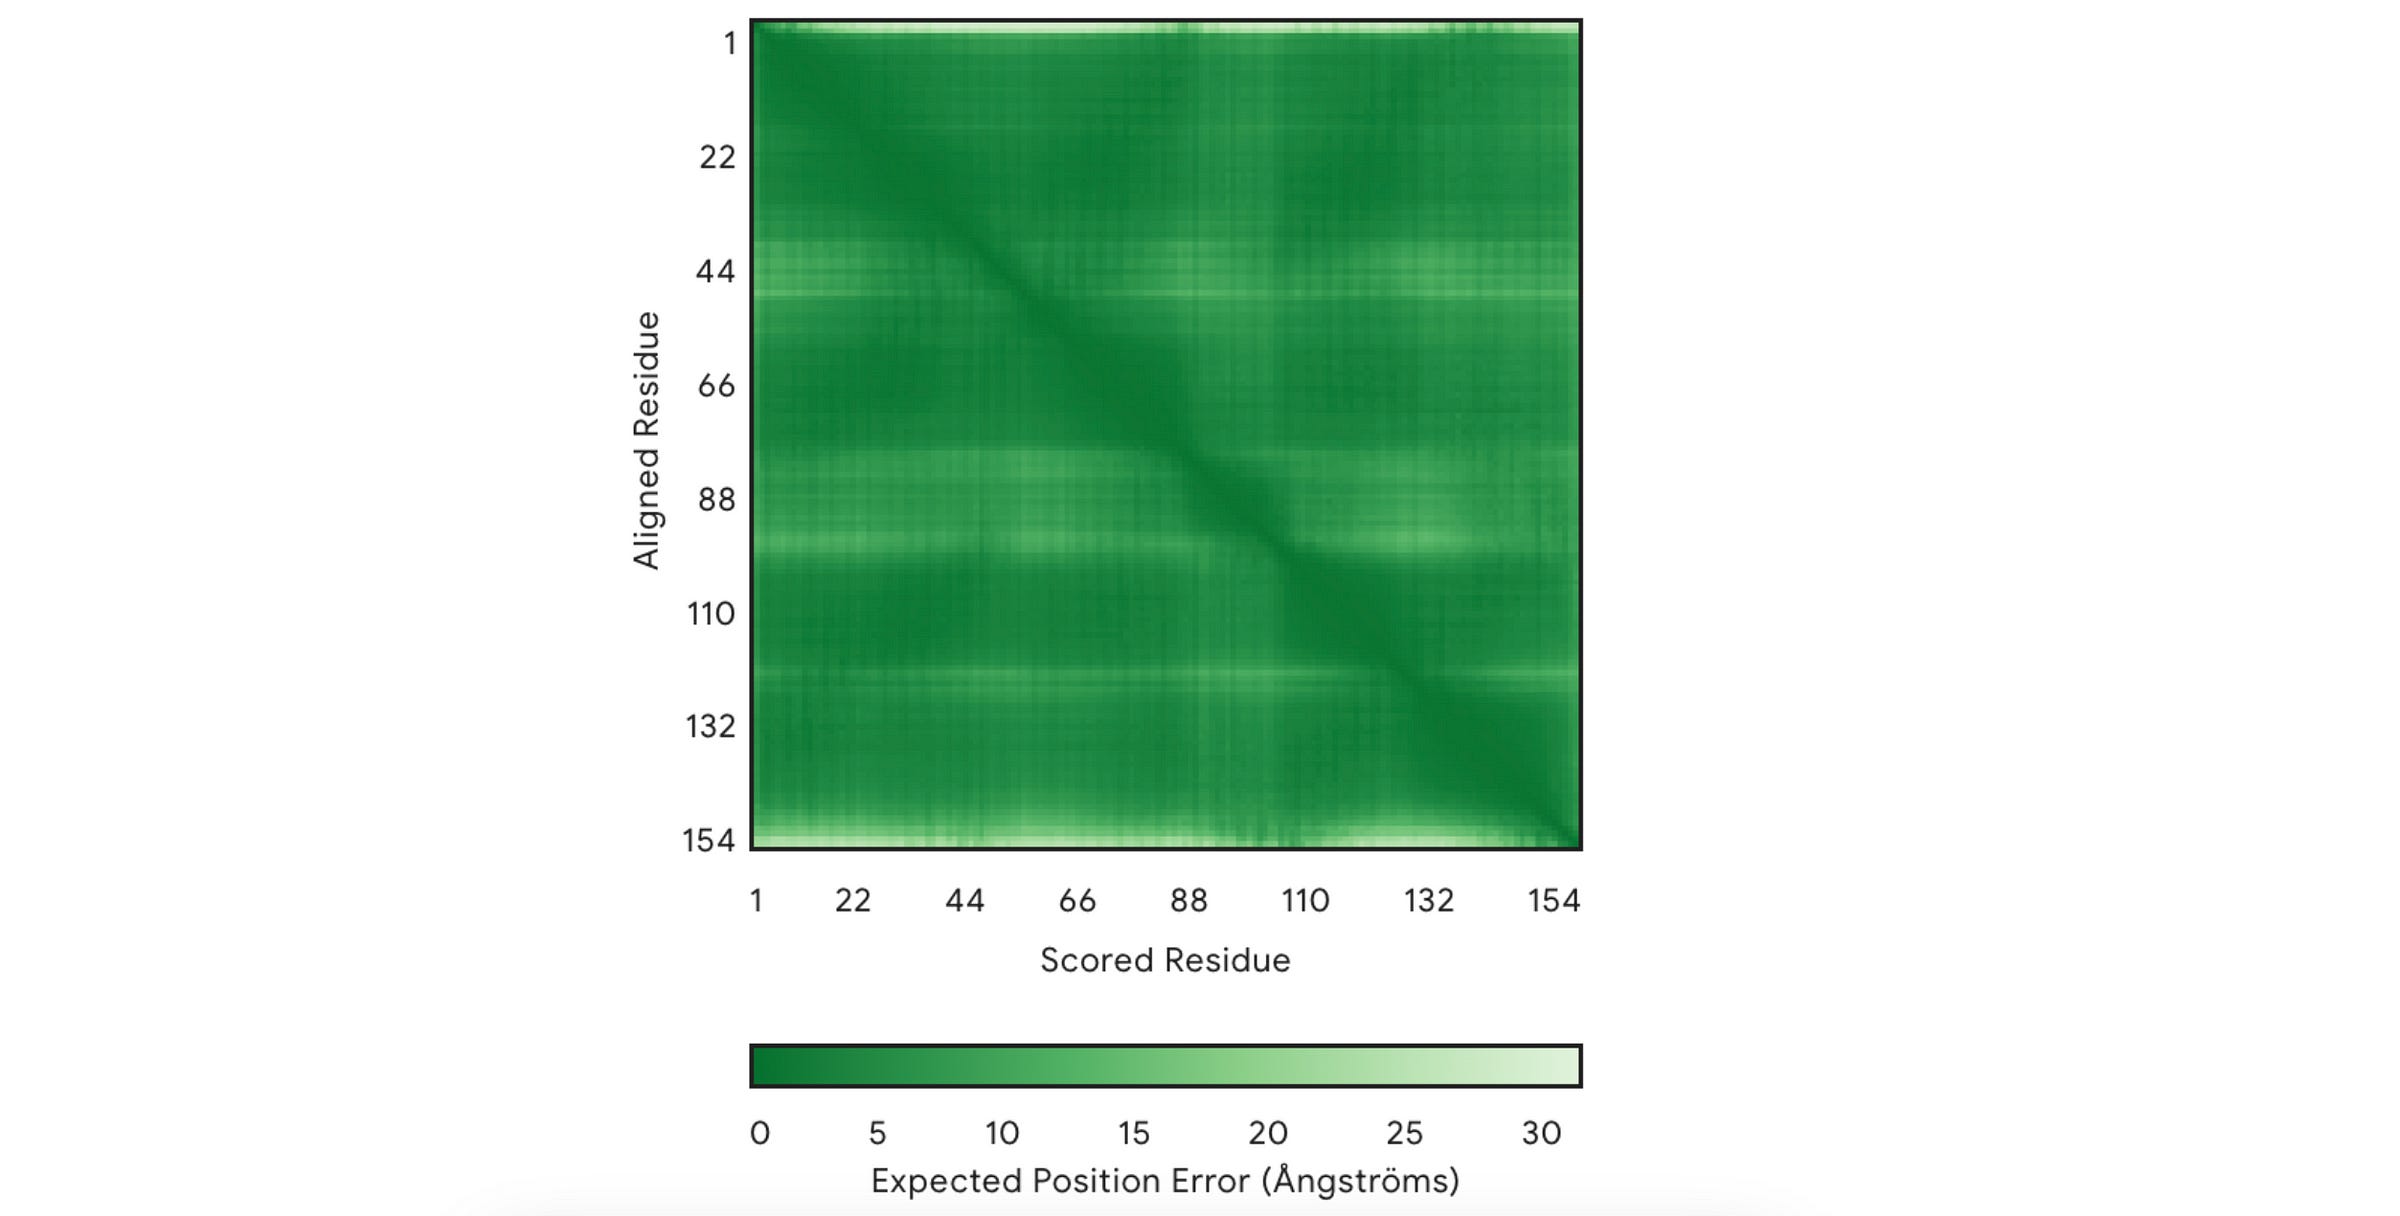
2. PAE (Predicted Aligned Error)
This measures how confident the model is in the relative position of two amino acids/ residues within the predicted structure.
It is shown using a 2D plot where both axes represent two residues.
In each square, the shade of green shows the predicted error in the distance (measured in Å) between two residues.
A dark green means a good prediction (low relative error)
A light green tile means poor prediction (high relative error)
There’s always a dark green line that runs from the top-left to the bottom-right of the plot. This line can be ignored because each residue is compared to itself on this line, so the error is always zero.
The top leftmost area shows the protein's N-terminus (the beginning part), and the bottom right-most area shows the C-terminus (end part).
For our example, the model is highly confident in the relative positions of most amino acids in the predicted structure.
3. pTM and ipTM scores
These are the predicted template modelling (pTM) score and the interface predicted template modelling (ipTM) score.
These scores are derived from a metric called the Template modelling (TM) score.
The pTM score tells how accurately the entire predicted structure folds compared to its true (experimental) structure.
A value of more than 0.5 means that the overall predicted fold might be correct.
The ipTM score measures the accuracy of the predicted relative positions of the subunits within the protein complex.
This is true for proteins in their quaternary structure with multiple subunits.
A value of more than 0.8 represents confident, high-quality predictions, but below 0.6 means that a prediction has likely failed.
For our example, the results are as follows:

The ipTM is left blank ( — ) since our protein is a monomer (has just one unit).
The pTM score is 0.83 which suggests confident prediction as compared to its true (experimental) structure.
All of the above metrics, considered together, suggest that AlphaFold did a pretty great job at its prediction.
Downloading The Results
The above results can be downloaded as a zip file, as shown below.
AlphaFold generates multiple models (typically five) for each protein, with the one labelled with 0 as the best prediction.
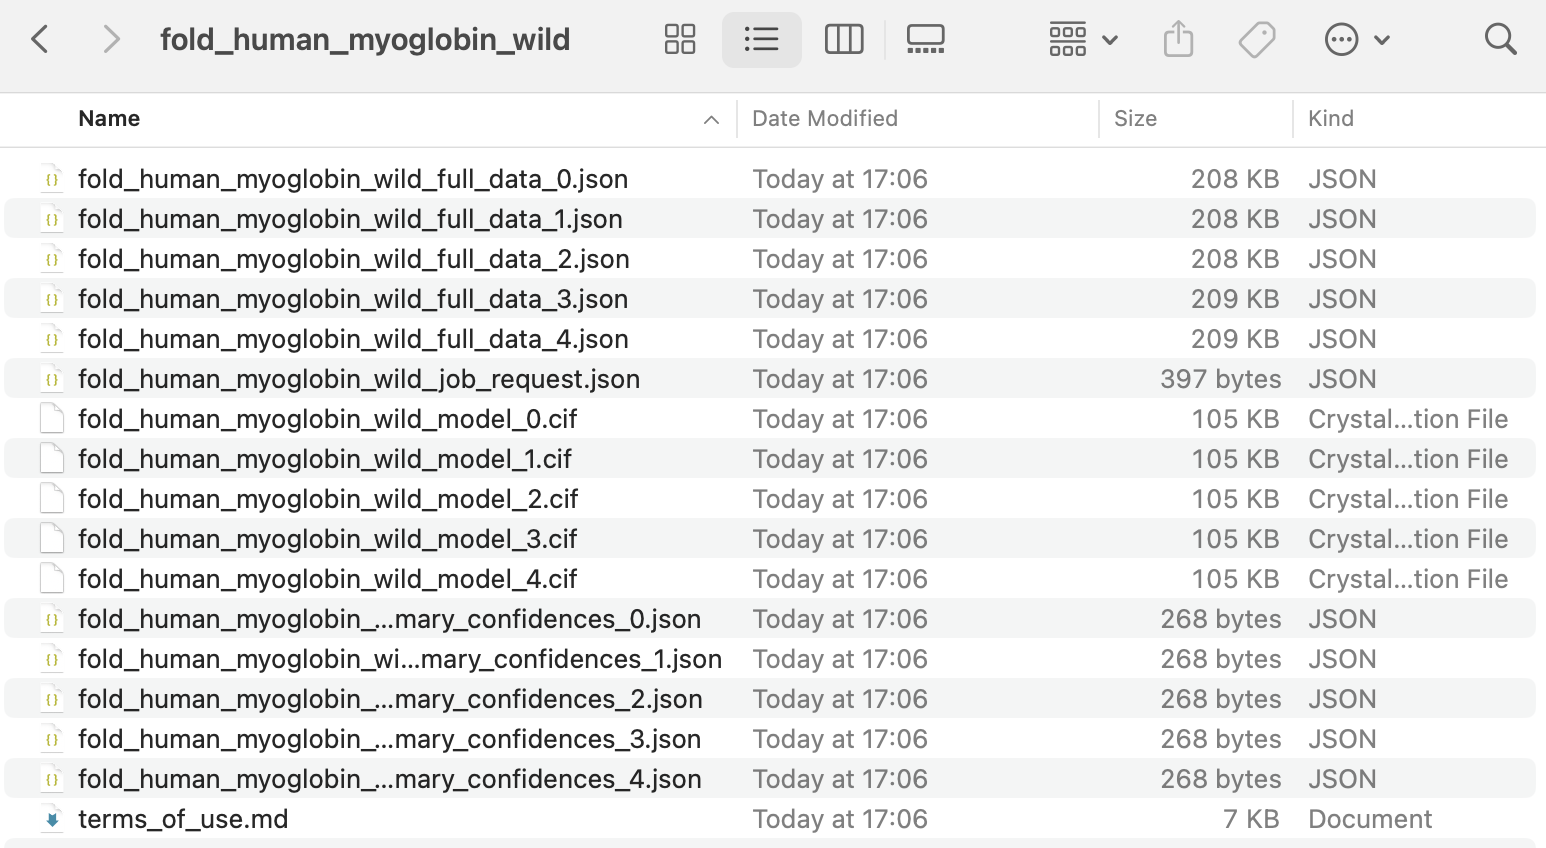
The shown files mean the following:
.ciffiles: These are the 3D structure predictions of the protein, which can be viewed using molecular visualization tools such as PyMOL.*_full_data_*.jsonfiles: These contain detailed prediction data for each protein prediction.️
*_mary_confidences_*.jsonfiles: These contain summarized confidence scores for quickly evaluating each prediction’s reliability.job_request.json: This contains the input sequence and model settings used for the predictions.terms_of_use.md: This contains AlphaFold’s license and usage terms.
Exploring The AlphaFold Protein Structure Database
Since the protein that we folded is a common one, it should be available on the AlphaFold Protein Structure Database (AFPD) by default.
A quick search with the term ‘Human Myoglobin’ returns the following result.
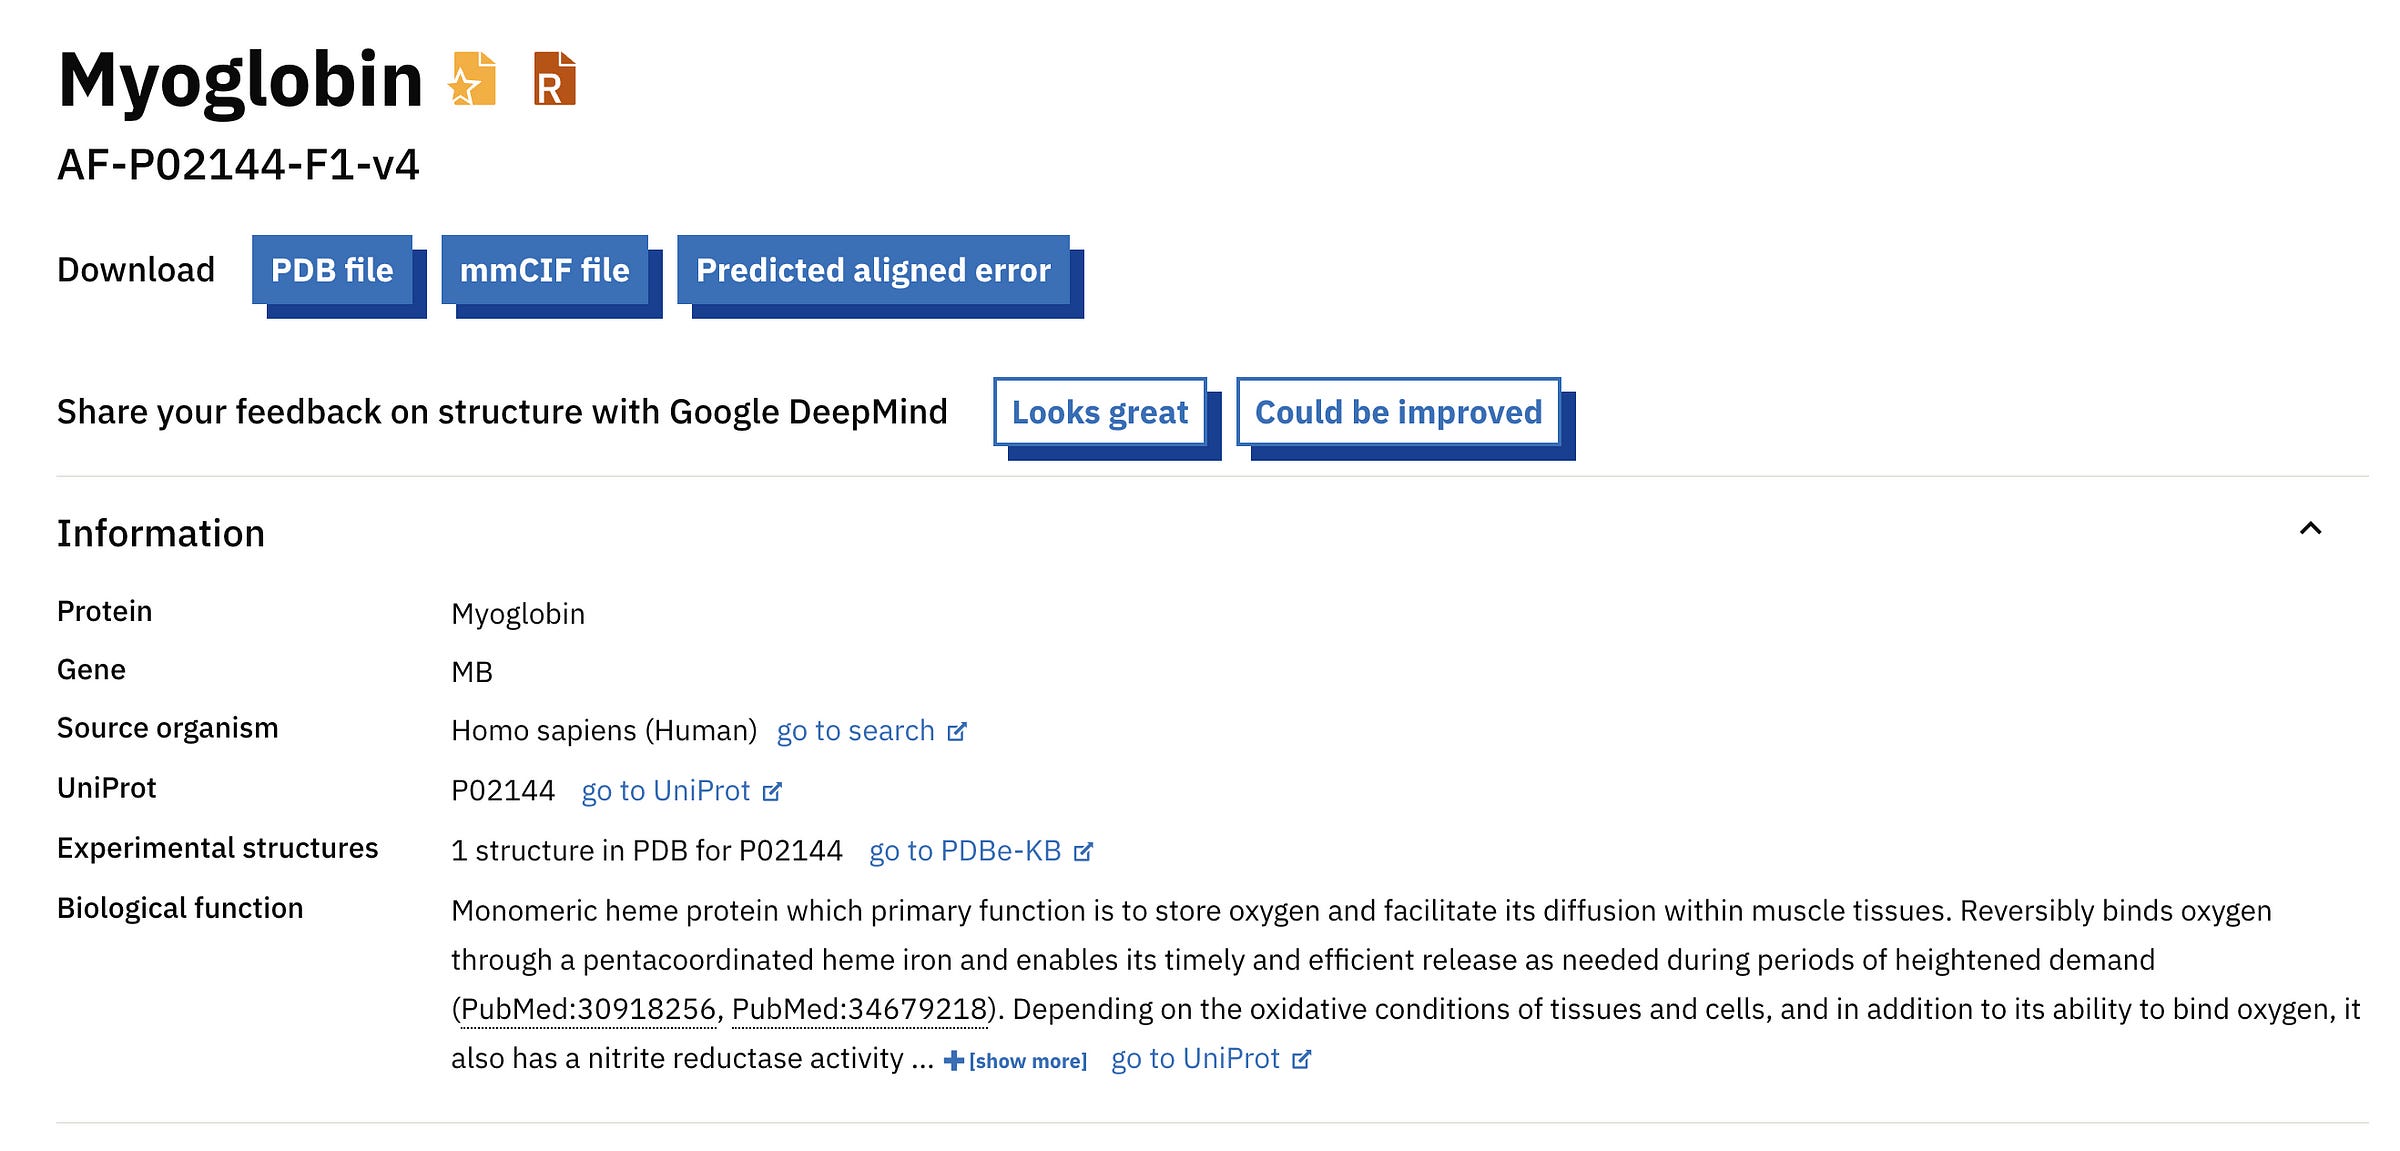
Comparing this with the UniProt accession number we used tells us we are looking at the right protein.
We can download the PDB (Protein Data Bank file), CIF (Crystallographic Information File) and PAE (Predicted Aligned Error) files from this page.
PDB and CIF files store the 3D structural data of the protein.
PAE file contains the model’s Predicted Aligned Error for the protein in JSON format.
Another cool feature is that we can dynamically select the PAE plot to see which areas it corresponds to.
At the bottom of the screen, you can see three tabs:
Model Confidence: this colours the protein as per the pLDDT score
TED Domains: this colours the protein as per the number of domains (just green in our case because our protein has one domain)
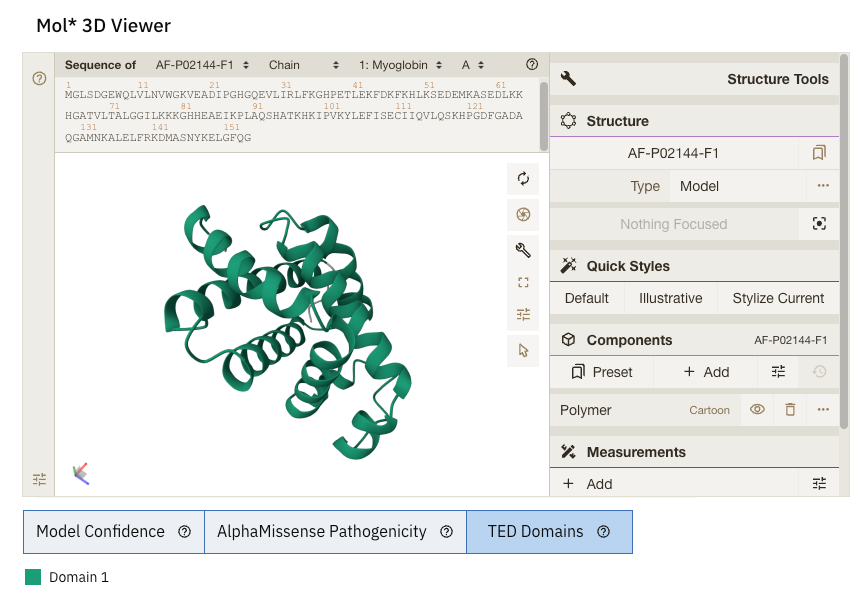
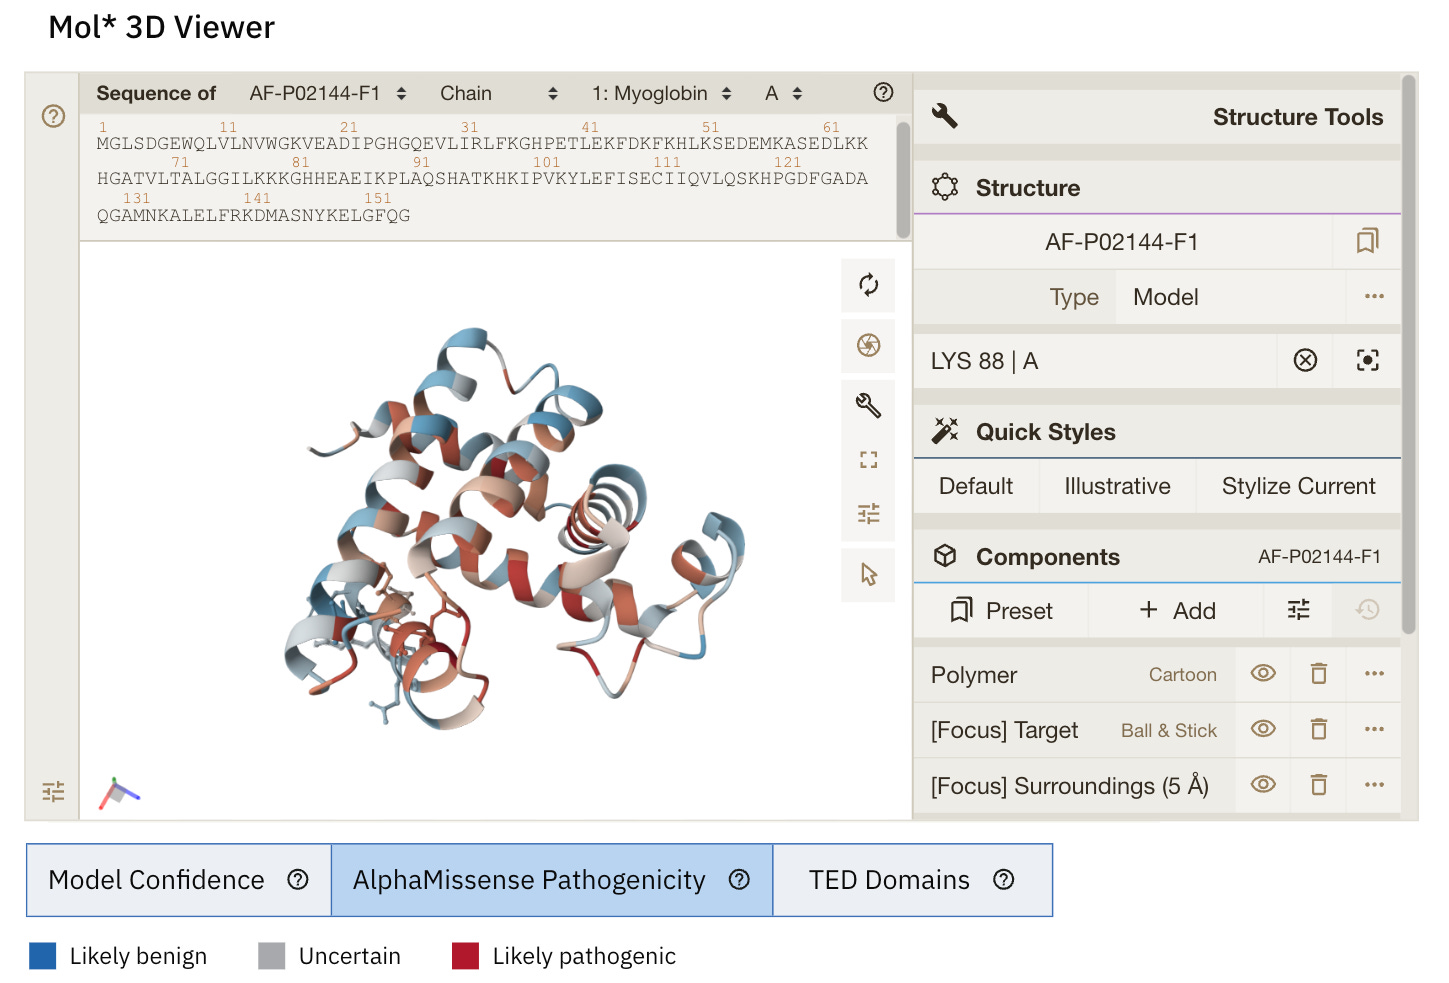
AlphaMissense Pathogenicity (we will discuss this in the next section in detail)
Exploring AlphaMissense
AlphaMissense is another AI model developed by Google DeepMind that helps predict what happens to a protein when an amino acid in it is replaced by another due to a missense mutation in the gene encoding it.
(A missense mutation is a single nucleotide change in a gene that results in a different amino acid being encoded in the protein.)
AlphaMissense classifies the effects of the mutation as:
Benign (not causing disease)
Uncertain
Pathogenic (causing disease)
AlphaMissense returns a pathogenicity heatmap for each protein prediction with the above categories colour-coded.
The AlphaMissense headmap for human Myoglobin is shown below.
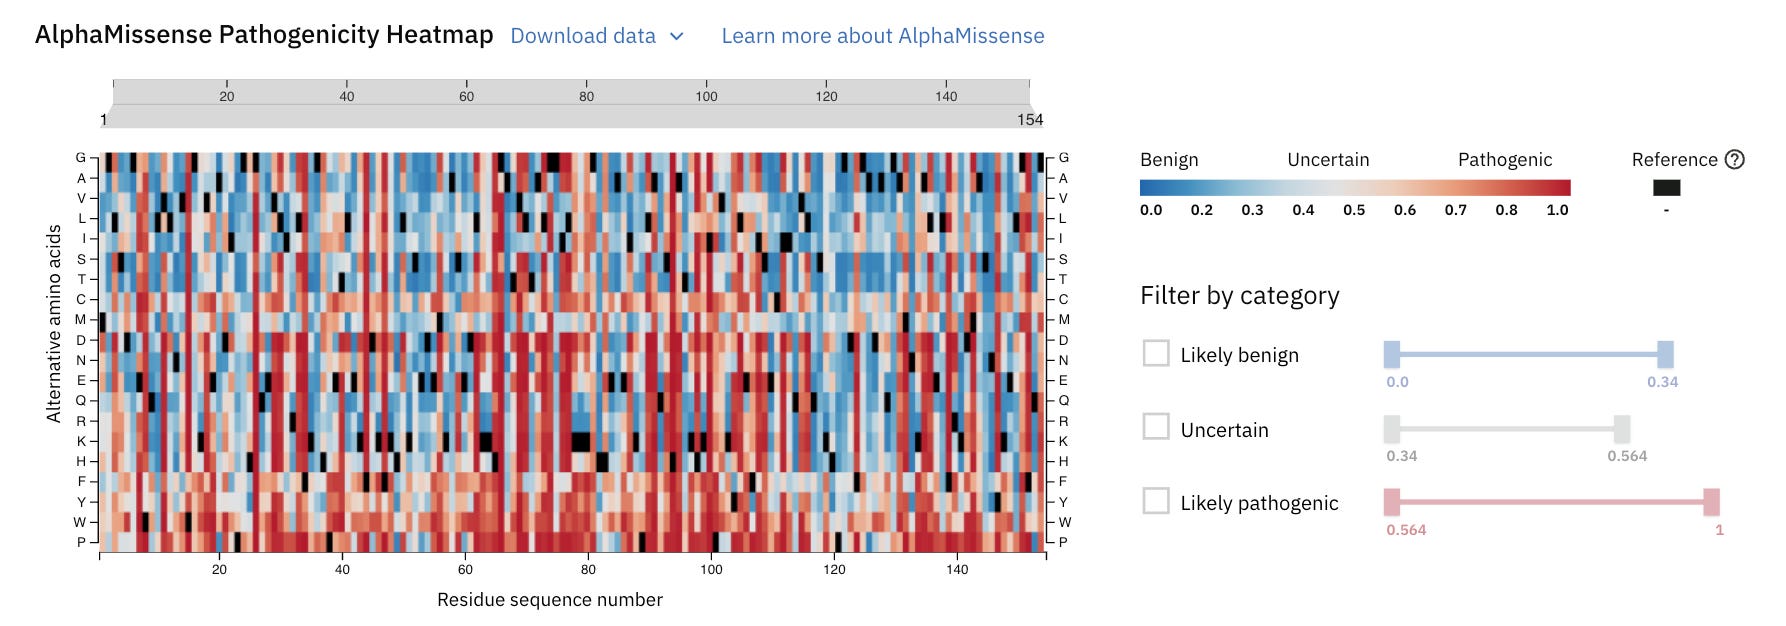
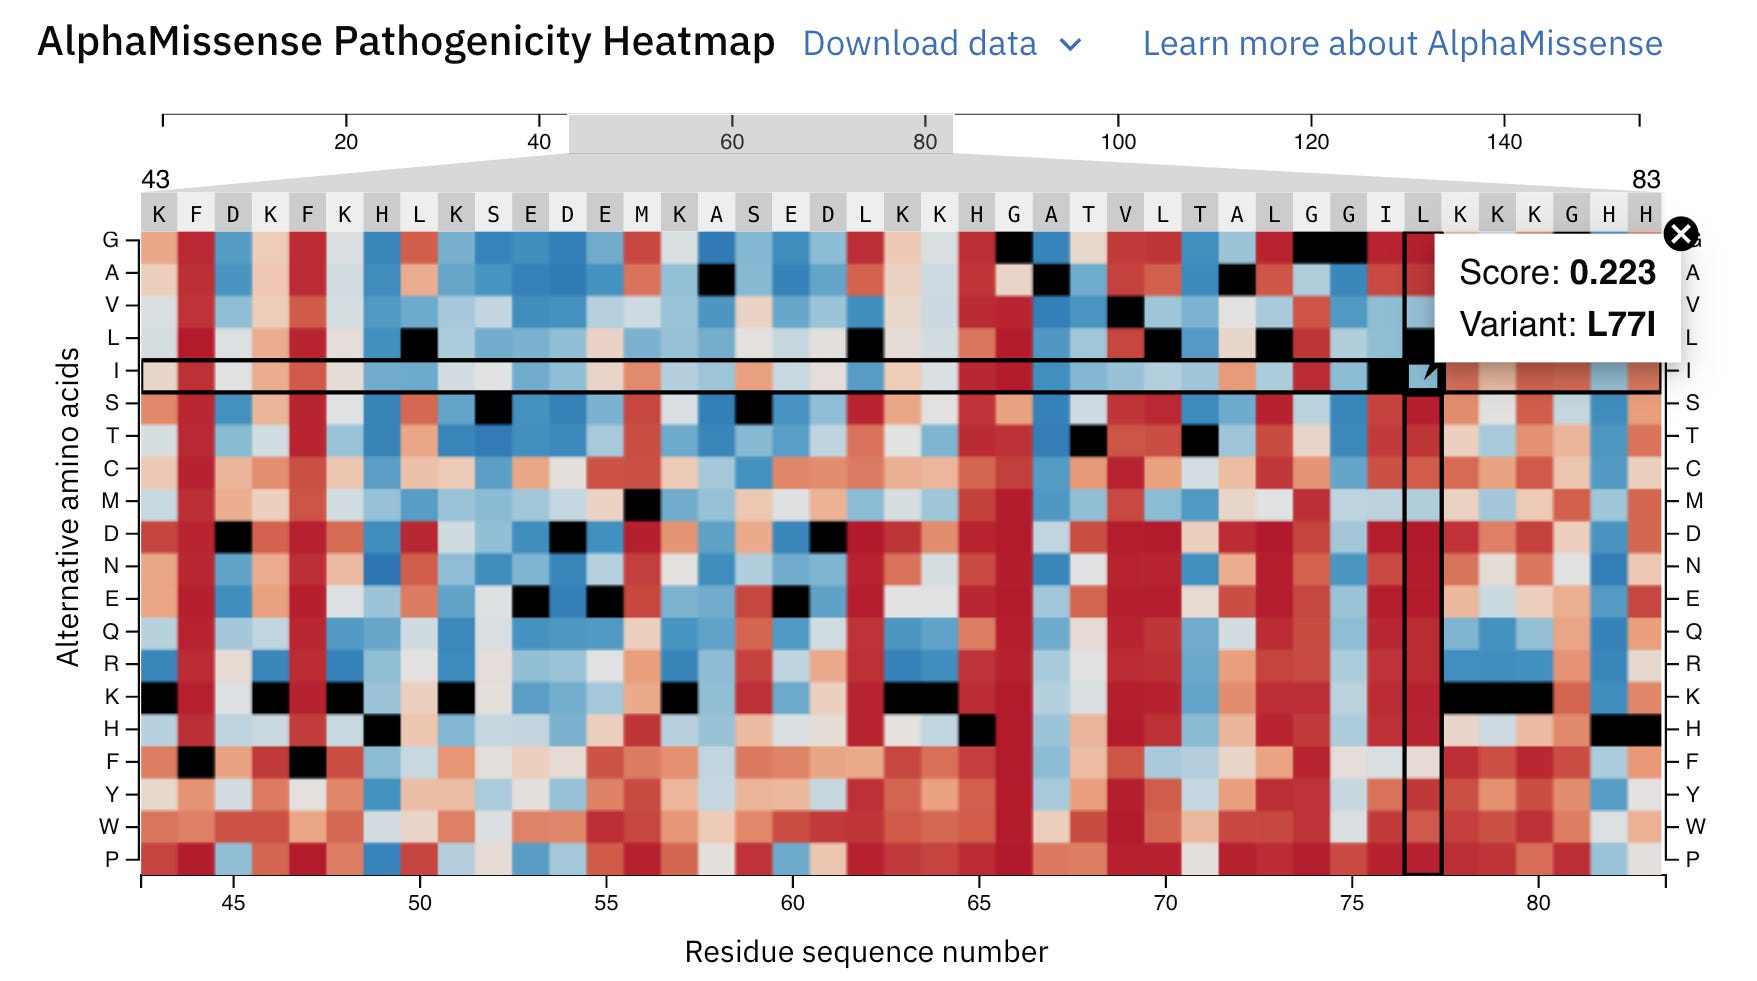
Let’s zoom into it to learn better.
A position 77, the usual amino acid should be L (Leucine) (denoted by Reference black colour), but if a mutation causes it to change to G (Glycine), this is highly pathogenic or disease-causing (denoted with a dark red colour) with a high pathogenicity score (0.983).
It will likely impair the function of Myoglobin in individuals with this mutation.
At the same place, if the amino acid is replaced by I (Isoleucine), the mutation will likely be benign or harmless.
When the 3D visualisation is switched to the ‘AlphaMissense Pathogenicity’ tab, the displayed colour for each amino acid is the average AlphaMissense pathogenicity score across all possible amino acid substitutions at that position.
Exploring Similar Protein Structures
On the results page, we can also find the most structurally similar proteins to human Myoglobin.
When two proteins have similar structures, it often means that they evolved from a common ancestor.
However, unrelated proteins can also develop similar structures to perform comparable functions.
This similarity search is really helpful to us when performing evolutionary studies.
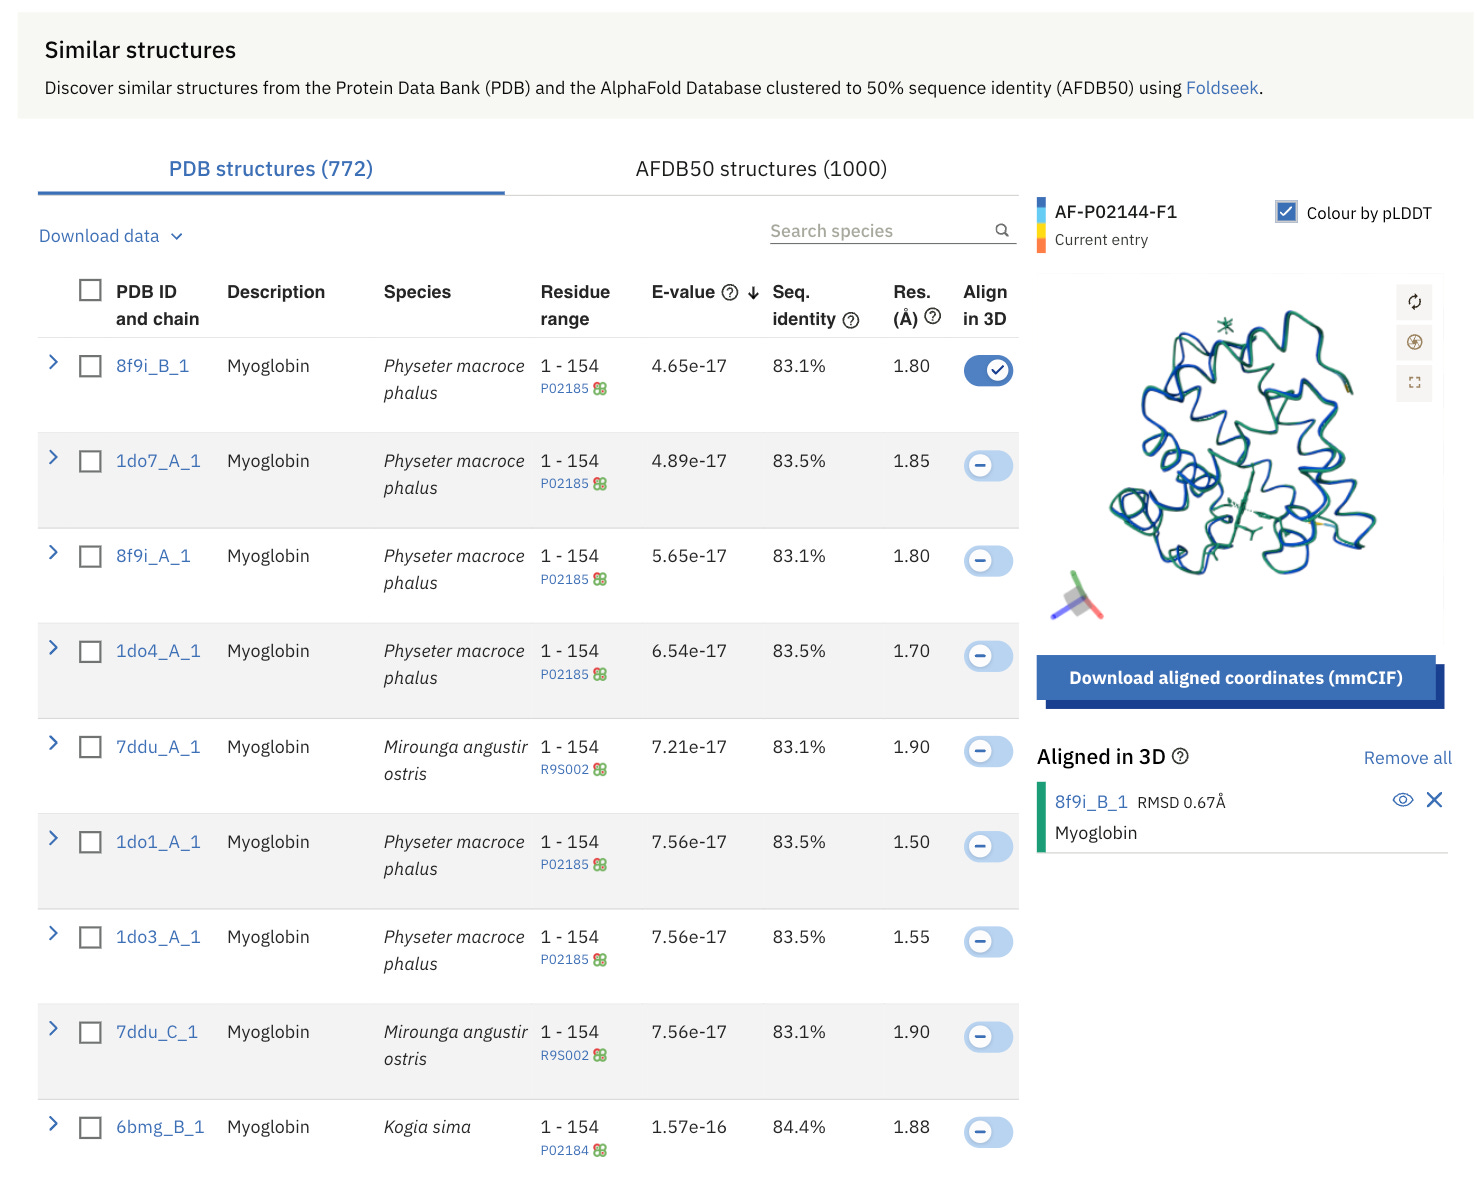
The structural similarity search on the results page uses Foldseek, which is a computational tool designed for rapid and sensitive comparisons of large protein structure datasets.
FoldSeek searches for similar protein structures from the Protein Data Bank (PDB) and AFDB50.
The Protein Data Bank (PDB) is a global archive of experimentally determined 3D structures of proteins and nucleic acids (DNA and RNA).
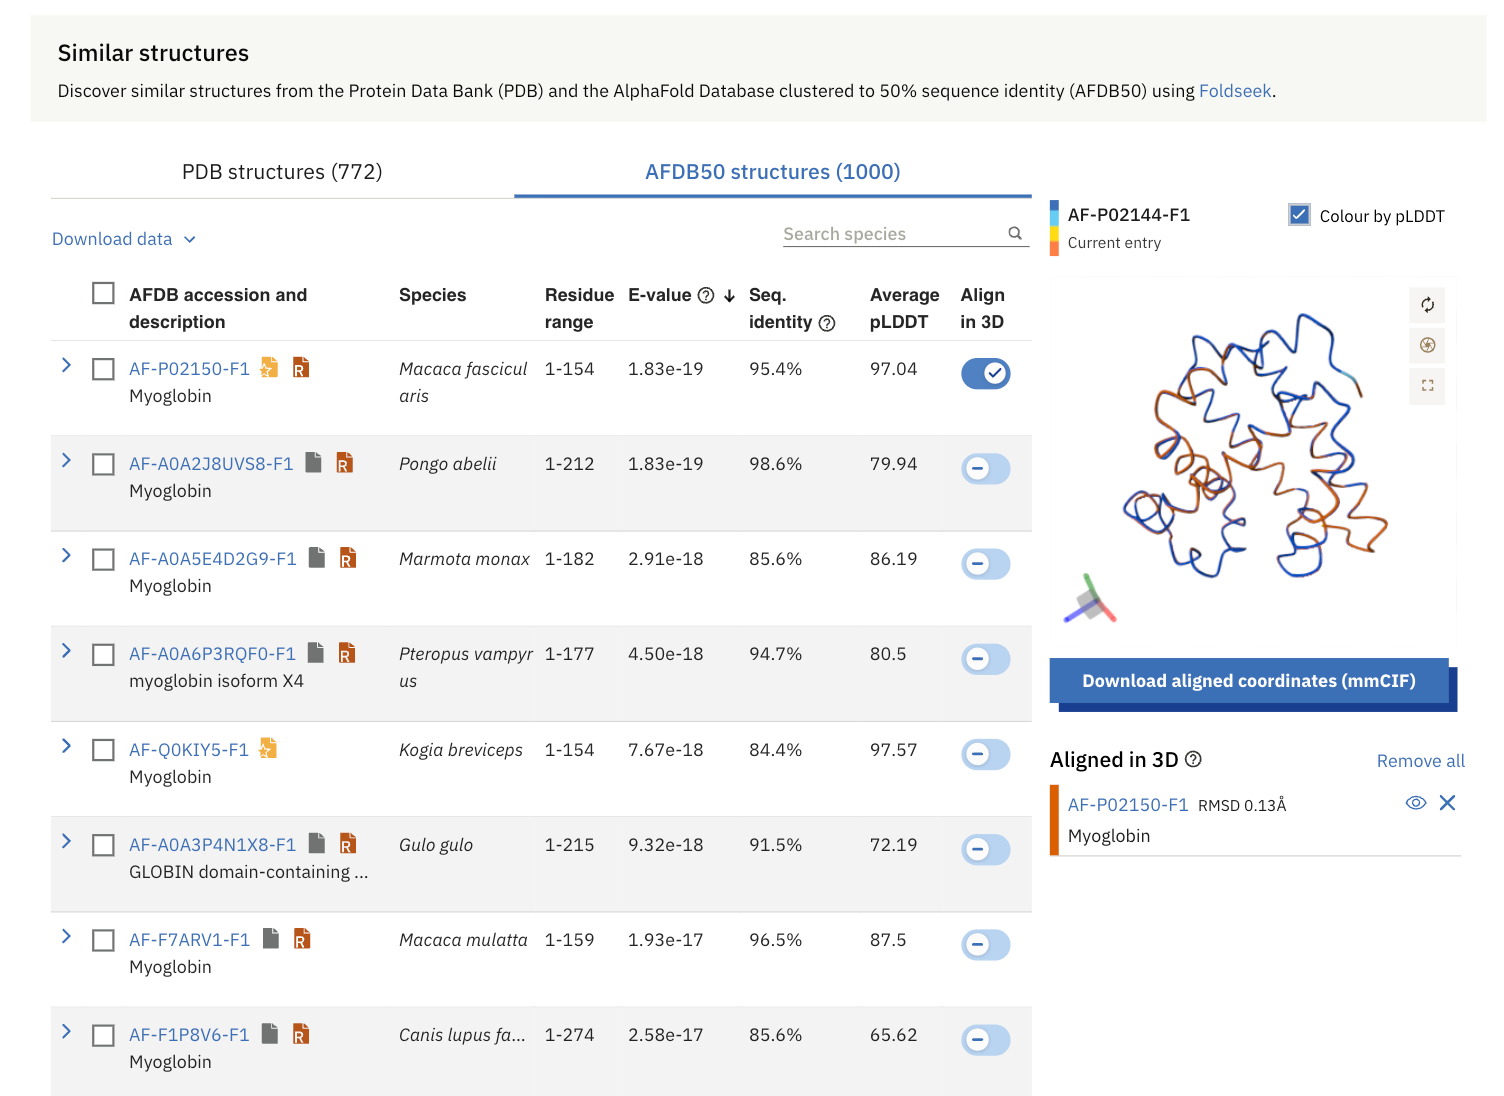
AFDB50 is a collection within the AlphaFold Protein Structure Database (AFDB), where proteins with similar sequences (sharing at least 50% identity) are grouped together. Each group is represented by the protein with the most confidently predicted structure.
Two metrics are important to evaluate these similarity-matching results:
Sequence Identity: This is the percentage of identical residues between aligned sequences over the aligned length.
E-value: This is the likelihood of a match between the query and target sequence in a structural alignment. The lower the E-value, the more
significant the alignment.
Surprisingly, the highest similarly scoring protein for human Myoglobin from the PDB is Myoglobin from Sperm Whales (Physeter macrocephalus).
These myoglobins can be aligned in 3D and are shown in the visual on the right-hand side.
Similarly, from AFDB50, the most similar protein to human Myoglobin is the Myoglobin from Crab-eating macaques (Macaca fascicularis).
Again, both of these myoglobins are aligned in 3D and are shown in the visual on the right-hand side.
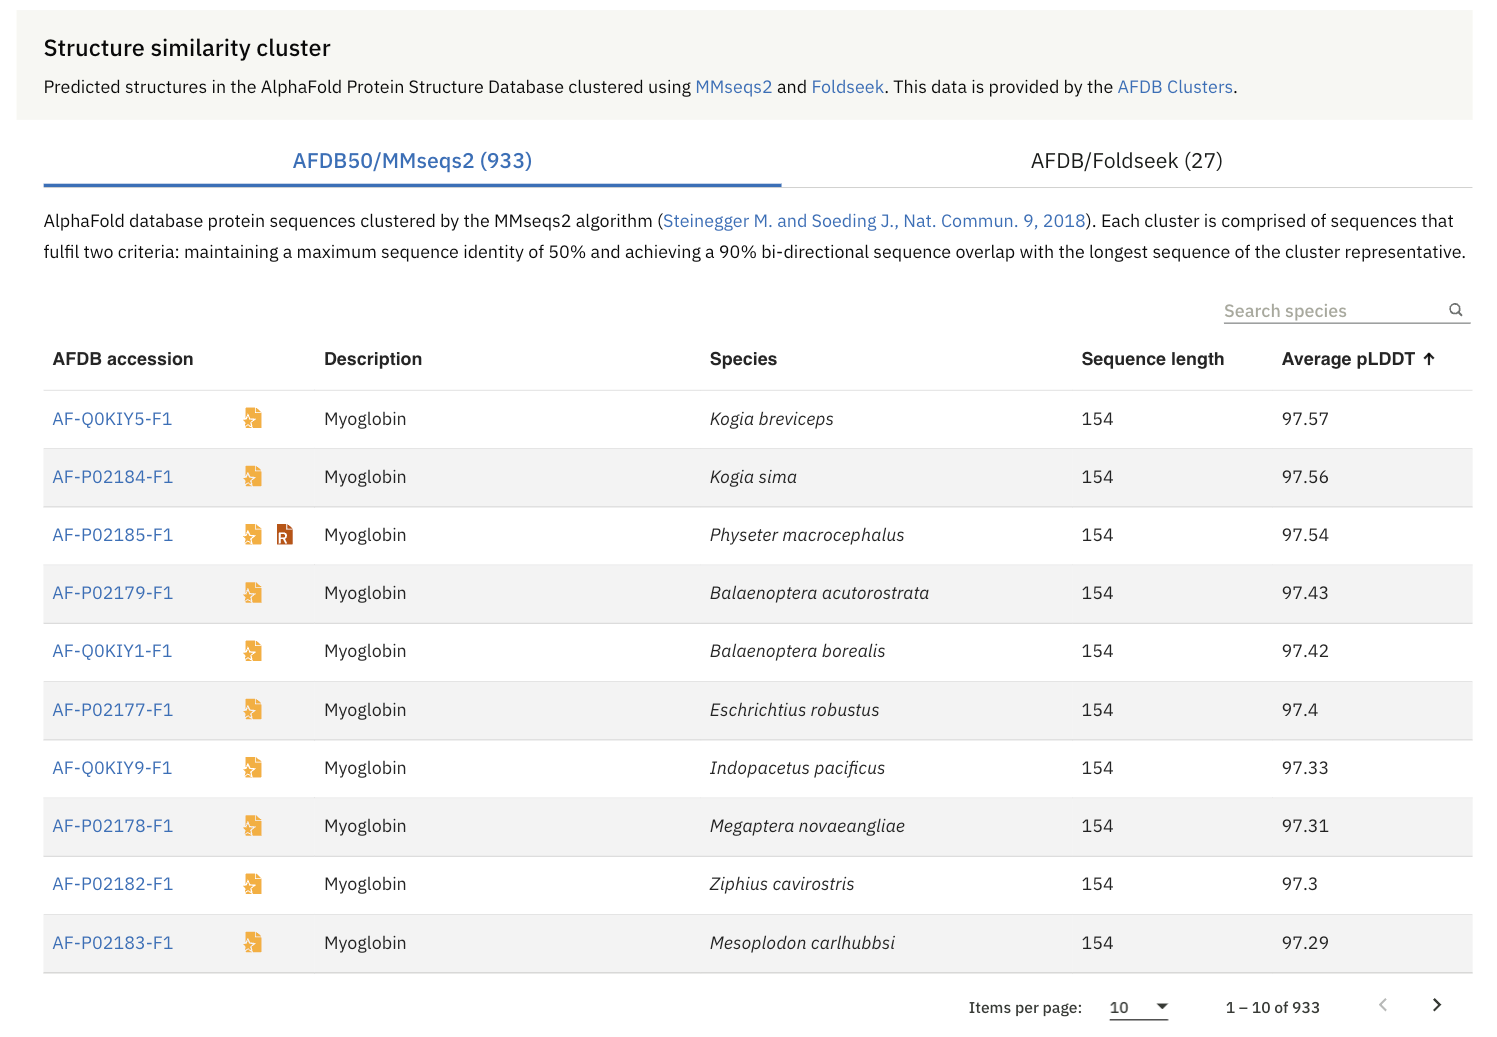
While the above is a quick structure-based search, the AlphaFold database also gives a broader and more thorough similarity context for a protein.
It is through Structure Similarity Clustering, which is pre-computed over the AlphaFold Protein Structure Database using two approaches:
Sequence-based clustering (AFDB50/MMseqs2): where protein sequences in AFDB are grouped based on amino acid sequence similarity using the MMseqs2 algorithm
Structure-based clustering (AFDB/Foldseek): where the representative proteins from the first step are further clustered based on structural similarity using Foldseek.
I hope you briefly understood how to use AlphaFold in this lesson.
While it may not have every little detail about the tool, it’s a great starting point.
I’d love to hear from you in the comments below about how you’re using AlphaFold and any exciting use cases you’re applying it to.
Further Reading
Source Of Images
All images (including the screenshots from the respective websites) used in the article are sourced by the author unless specified otherwise.
